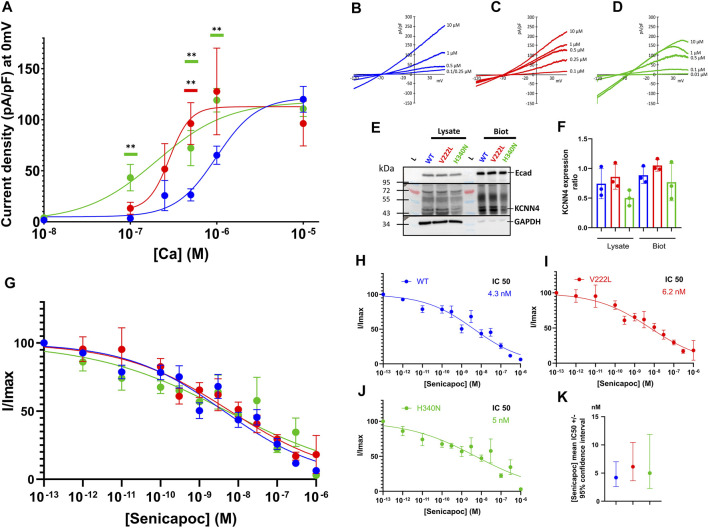
FIGURE 4.
Calcium sensitivity of KCNN4 mutations V222L and H340N in HEK293T cells. (A) Current density (pA/pF) was measured in response to (Ca2+)i for KCNN4 WT (blue), V222L (red), and H340N (green). Experimental values were fitted with a variable slope model (Hill equation) (Y = Ymin + (Xhillslope)*(Ymax- Ymin)/(Xhillslope + EC50Hillslope). The resulting EC50 corresponds to the (Ca2+)i at which half of the max current is reached. (B–D) Representative I/V curves for WT, V222L, and H340N at different Ca2+ concentrations (0.01–0.1–0.25–0.5–1, and 10 µM). Statistical analysis against WT at different Ca2+ concentrations was performed using a Kruskal–Wallis test followed by an uncorrected Dunn’s test, n = 7–12 (*: p < 0.05; **: p < 0.01). (E) Representative western blot showing total (Lysate) or only surface (Biot) protein expression of KCNN4 WT, V222L, and H340N in HEK293T-transfected cells. Total fraction corresponded to cell lysate and biotinylated fraction corresponded to membrane proteins. We used GAPDH as housekeeping for total fraction quantification (lysate) and E-cadherin for biotinylated fraction quantification. In KCNN4 labeling, the three bands between 43 kDa and 55 kDa corresponded to different glycosylated states of the protein. In lysate, the band at 72 kDa is non-specific. (F) Ratio KCNN4/GAPDH in lysate and KCNN4/ECadherin (biotinylation) were calculated from three independent Western Blots, taking the total KCNN4 signal. No significantly increased expression with V222L and H340N compared to WT KCNN4 was observed. Only H340N tended to have a reduced expression. Kruskal–Wallis test was used to determine statistical significance against WT. (G) Senicapoc sensitivity of KCNN4 WT or mutated. Normalized currents were measured in response to [Senicapoc] for WT (blue), V222L (red), and H340N (green). Experimental values were fitted with variable slope model (Hill equation): Y = 100/(1 + (IC50/X)hillslope). The resulting IC50 corresponded to 50% inhibition by Senicapoc; the mean value ±95% confidence interval of IC50 is represented in (K), n = 15–21. For clarity purposes, fits are represented alone for each condition (H,I,J). Statistical analyses were performed using a Kruskal–Wallis test followed by an uncorrected Dunn’s test, n = 15–21.

