FIGURE 2.
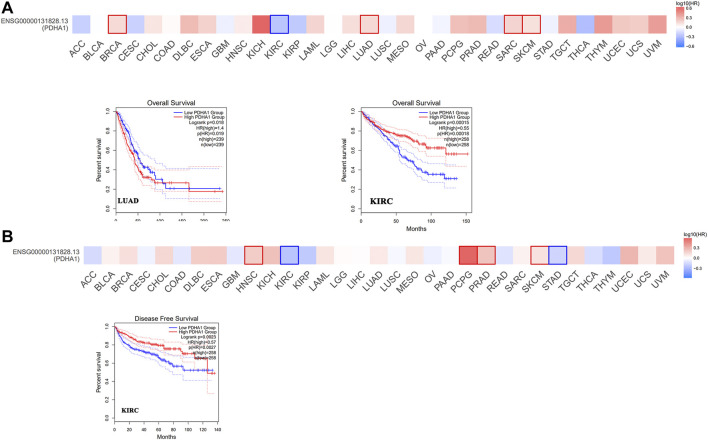
Survival analysis of PDHA1 expression in pan-cancer. (A,B) GEPIA2 indicated the roles of PDHA1 expression in patients’ prognosis, including OS (A) and DFS (B). High cutoff (50%) and low cutoff (50%) values were used as the expression thresholds for splitting the high-expression and low-expression cohorts. The cutoff value was as follows: p-value < 0.01 and | logFC| > 1.

