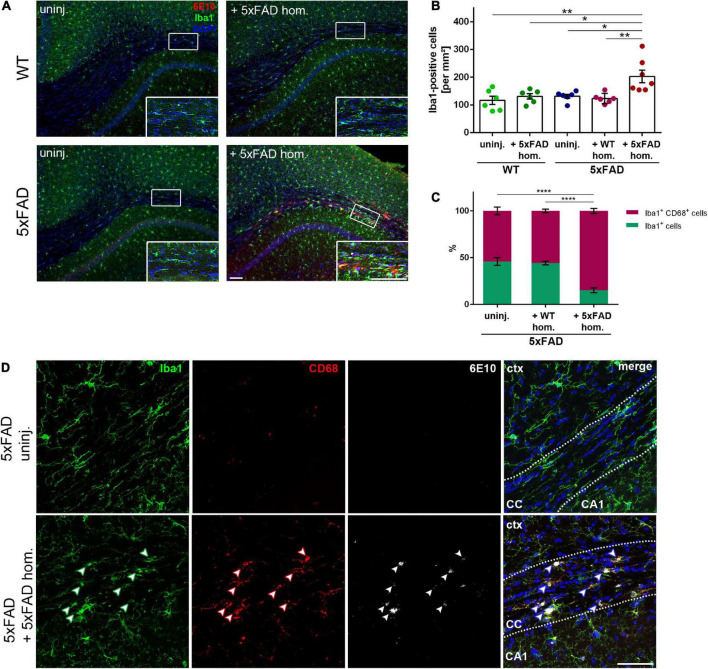
FIGURE 2.
Enhanced microglia density and phagocytic activity in the corpus callosum (CC) of amyloid-beta peptide (Aβ)-seeded mice. (A) Immunofluorescent Iba1 (green) and 6E10 (red) staining of 4-month-old WT and 5xFAD mice, which were either uninjected or injected with 5xFAD brain homogenate. Scale bar for overview and inset 100 μm. (B) Respective quantification of Iba1-positive cells in the CC. n = 6–7 mice with n = 4–5 sections analyzed per animal. Each symbol represents data from one mouse. Mean ± SEM, Kruskal–Wallis test followed by Dunn’s multiple comparison test, *p < 0.05, **p < 0.01. (C) Quantification of the ratio between Iba1 single-positive and Iba1 and CD68 double-positive cells in the CC of 5xFAD animals, either uninjected or injected with either WT or 5xFAD homogenate. n = 4–5 mice with n = 5 sections analyzed per animal. Mean ± SEM, two-way ANOVA followed by Tukey’s multiple comparison test, ****p < 0.0001. (D) Confocal images of Iba1 (green), CD68 (red), and 6E10 (white) of 5xFAD mice, either not injected or injected with 5xFAD brain extract. Dashed line marks the CC. Arrowheads indicate microglial CD68 expression adjacent to Aβ deposits. Abbreviations: Ctx, cortex; CA1, hippocampal CA1 region; CC, corpus callosum. Scale bar 50 μm.

