FIGURE 4.
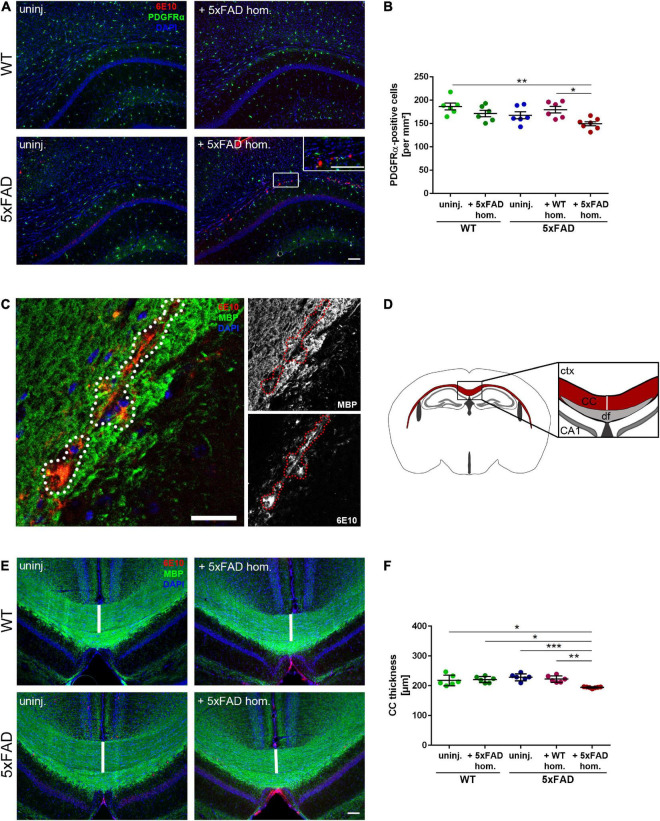
Reduced oligodendrocyte progenitor cell (OPC) number and disrupted white matter integrity in the corpus callosum (CC) exhibiting amyloid-beta peptide (Aβ) deposits. (A) Representative immunofluorescent staining of PDGFRα (green) and Aβ (red) of 4-month-old WT and 5xFAD mice, which were either uninjected or injected with 5xFAD brain homogenate. Scale bar for overview and inset 100 μm. (B) Respective analysis of PDGFRα-positive cells in the CC. n = 6–7 mice analyzing n = 4–5 sections per animal. Each symbol represents data from one mouse. Mean ± SEM, Kruskal–Wallis test followed by Dunn’s multiple comparison test, *p < 0.05, **p < 0.01. (C) Confocal microscopy of MBP (green) and Aβ (red) of 4-month-old 5xFAD mouse injected with 5xFAD brain homogenate. Dashed line indicates focal absence of MBP signal, which co-localizes with Aβ. Scale bar 30 μm. (D) Graphic representation of the region of interest (indicated as a white line) in the CC (red) used to quantify the CC thickness. Abbreviations: Ctx, cortex; CA1, hippocampal CA1 region; df, dorsal fornix; CC, corpus callosum. (E) Fluorescence microscopy visualizing MBP (green) and Aβ (red) of 4-month-old WT and 5xFAD mice, which were either uninjected or injected with 5xFAD brain homogenate. Scale bar 100 μm. (F) Respective quantification of the CC thickness. n = 6–7 mice with n = 3–5 sections analyzed per animal. Each symbol represents data from one animal. Mean ± SEM, Kruskal–Wallis test followed by Dunn’s multiple comparison test was used, comparing the Aβ seeded animals to the other 5xFAD groups. *p < 0.05, **p < 0.01, ***p < 0.0005.

