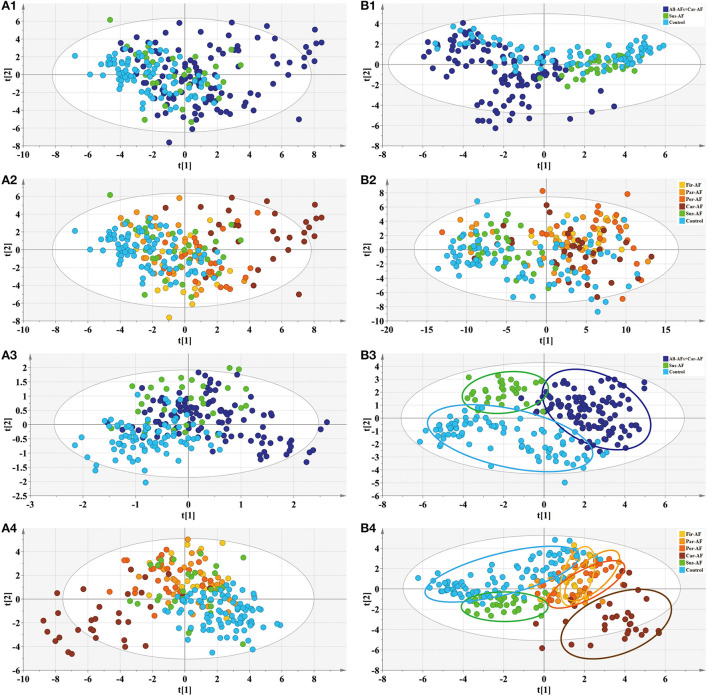
Figure 2.
Multivariate statistical analysis differentiates the groups of Control and Experimental groups based on clinical information (A) and metabolomic data (B), respectively. (1) PCA modeling displays the original similarity of the three groups. (2) PCA modeling displays the original similarity of the six groups. (A1,A2) R2X (cum) = 0.499, Q2 (cum) = 0.204; R2X (cum) = 0.499, Q2 (cum) = 0.204. (B1,B2) R2X (cum) = 0.504, Q2X (cum) = 0.324; R2X (cum) = 0.508, Q2X (cum) = 0.369. (3) PLS-DA modeling with the three groups. (A3) R2X (cum) = 0.364, R2Y (cum) = 0.463, Q2X (cum) = 0.288. Permutation tests with the intercepts of R2 < 0.125, Q2 < −0.338. (B3) R2X (cum) = 0.337, R2Y (cum) = 0.687, Q2X (cum) = 0.59. Permutation tests with the intercepts of R2 < 0.252, Q2 < −0.312. (4) PLS-DA modeling with the six groups. (A4) R2X (cum) = 0.326, R2Y (cum) = 0.342, Q2X (cum) = 0.26. Permutation tests with the intercepts of R2 < 0.079, Q2 < −0.134. (B4) R2X (cum) = 0.383, R2Y (cum) = 0.43, Q2X (cum) = 0.329. Permutation tests with the intercepts of R2 < 0.125, Q2 < −0.178.

