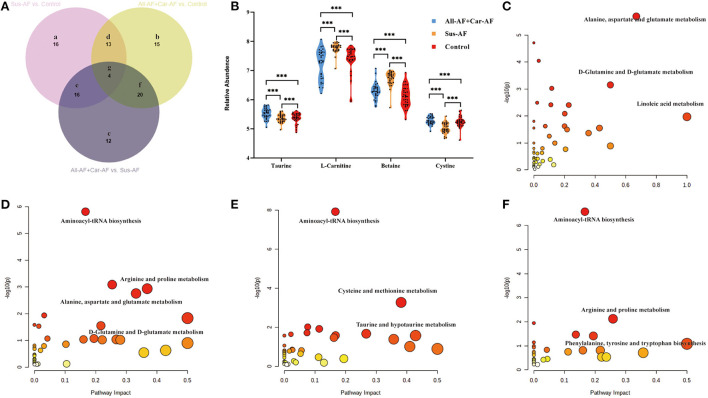
Figure 4.
Differential metabolites and pathways involved in the experimental groups. (A) Venn diagram shows discriminant metabolites can be classified into regions a, b, c, d, e, f, and g. (B) Serum taurine, L-carnitine, betaine, and cystine levels change in the three comparisons. (C) Pathway analysis of differential metabolites in Venn a+d+e+g region. (D) Pathway analysis of differential metabolites in Venn b+d+f+g region. (E) Pathway analysis of differential metabolites in Venn c+e+f+g region. (F) Pathway analysis of differential metabolites in Venn b+g. ***p < 0.01.

