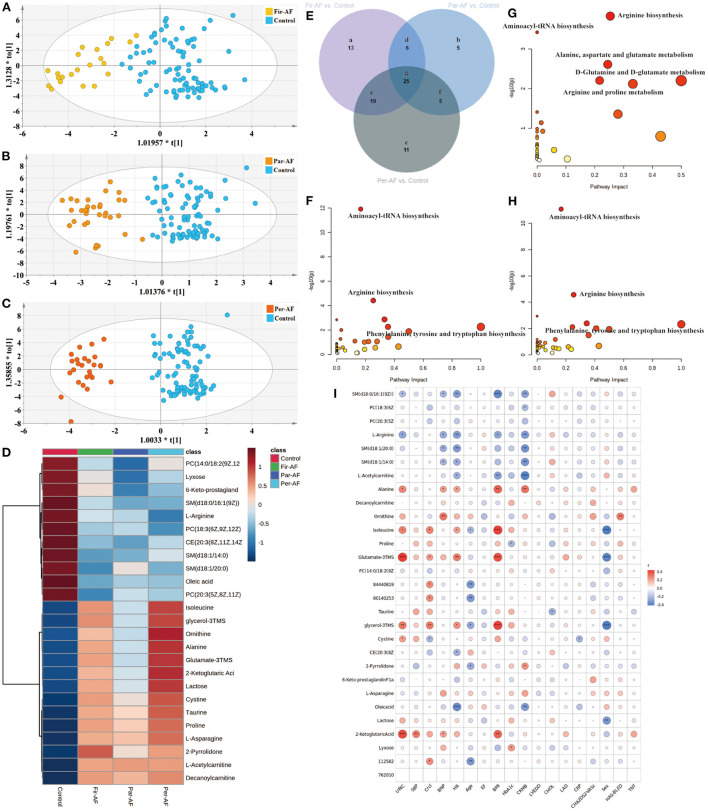
Figure 6.
Differential metabolites and pathways involved in the AF groups. (A–C) OPLS-DA modeling delineates different metabolic phenotypes of Fir-AF, Par-AF, and Per-AF cardiac cases from Control. R2X (cum) = 0.272, R2Y (cum) = 0.679, Q2X (cum) = 0.536; Permutation tests with the intercepts of R2 < 0.325, Q2 < -0.34. R2X (cum) = 0.315, R2Y (cum) = 0.812, Q2X (cum) = 0.633; Permutation tests with the intercepts of R2 < 0.458, Q2 < -0.473. R2X (cum) = 0.351, R2Y (cum) = 0.893, Q2X (cum) = 0.706; Permutation tests with the intercepts of R2 < 0.323, Q2 < -0.312. (D) Heatmap of the 25 differential metabolites in Control and all kinds of AFs. The colors changing from blue to red indicate high metabolites. (E) Venn diagram shows discriminant metabolites can be classified into 7 regions. (F) Pathway analysis of differential metabolites in Venn a, d, e, and g regions. (G) Pathway analysis of differential metabolites in Venn b, d, f and g. (H) Pathway analysis of differential metabolites in Venn c, e, f, and g regions. (I) The correlation coefficients between 25 potential biomarker contents and clinical characteristics. Blue represents negative correlation, and red represents positive correlation. Circle size represents the r-value of the metabolites and clinical characteristics. The symbol from * to ** and *** indicate the P-values between metabolites and clinical characteristics. *p < 0.05, **p < 0.01, and ***p < 0.001.

