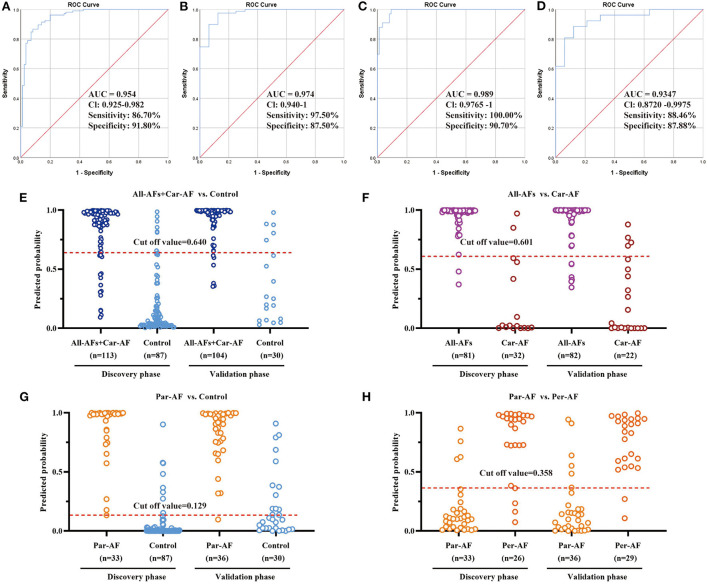
Figure 7.
Diagnostic Outcomes and Prediction Accuracies. The diagnostic outcomes in the discovery phase are shown via the ROC curves for comparison between (A) All-AFs plus Car-AF versus Control, (B) All-AFs versus Car-AF, (C) Par-AF versus Control, and (D) Par-AF versus Per-AF. The prediction accuracies by the biomarkers in the validation set were compared between (E) All-AFs plus Car-AF versus Control, (F) All-AFs versus Car-AF, (G) Par-AF versus Control, and (H) Par-AF versus Per-AF. AUC, area under the curve; CI, confidence interval.

