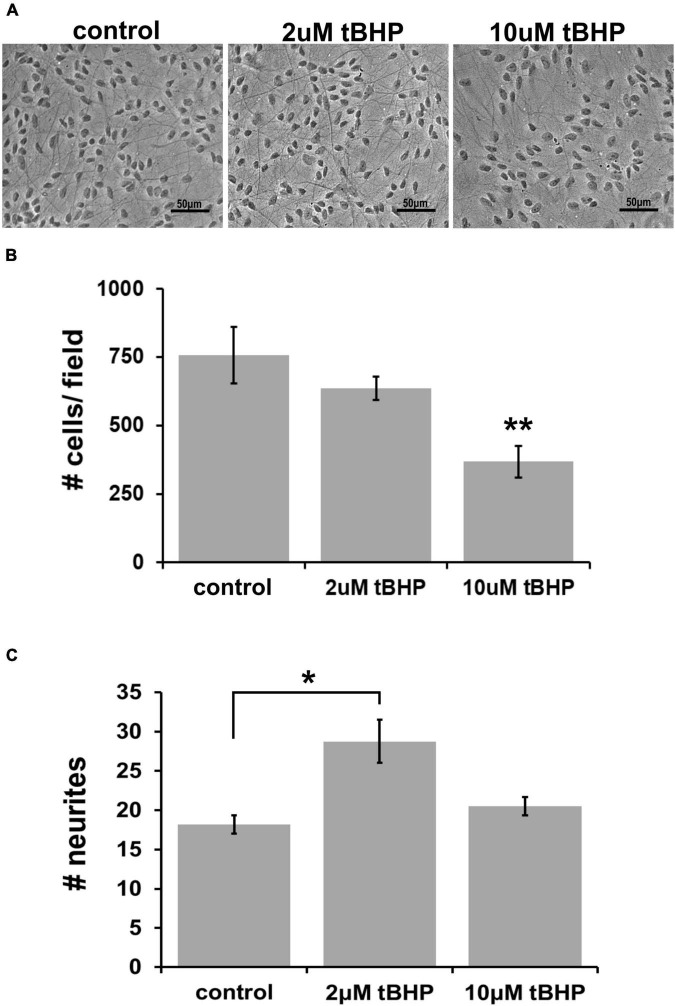
FIGURE 1.
Establishing the optimal parameters for oxidative stress in ReN cells. (A) Phase contrast image showing differentiated ReN cells under control conditions (cont) or exposure to 2 μM or 10 μM tert-butylhydroperoxide (tBHP). Note that there is a reduction in the number of cells when exposed to 10 μM tBHP (right panel). Magnification is 200×, scalebar is 50 μM. (B) Manual cell counts from phase contrast images reveal that 2 μM tBHP led to a 16% reduction while 10 μM tBHP led to a 52% reduction in the number of cells. (C) Measurement of the number of neurites along an intersecting line from the top of the field to the bottom of the field while avoiding soma reveals that 2 μM tBHP led to a 45% increase in neurite density while 10 μM tBHP had no effect on neurite density. Images were converted to binary (black and white) and lines were drawn from the top to the bottom of the field. The number of times the intensity went from 255 to 0 (encounter with a neurite) was counted and recorded to determine the number of neurites. Neurites from > 10 cells (between 10 and 20 cells) were analyzed and three samples, each with six trials, were measured to determine neurite number. *p ≤ 0.05, **p ≤ 0.01.

