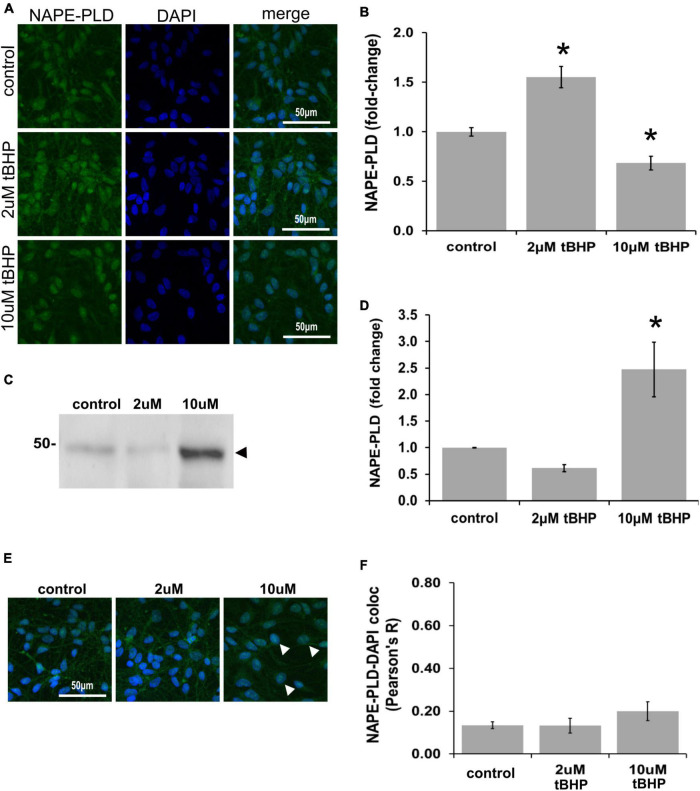
FIGURE 6.
Expression of N-acyl phosphatidylethanolamine phospholipase D (NAPE-PLD) in ReN cells under conditions of oxidative stress. (A) ReN cells express NAPE-PLD in the soma and nucleus. (B) Exposure of ReN cells to tert-butylhydroperoxide (tBHP) resulted in a biphasic NAPE-PLD expression pattern–2 μM tBHP led to a 20% increase in NAPE-PLD expression. Green fluorescence is NAPE-PLD and blue fluorescence is DAPI. (C,D) Western blot analysis reveals that the expression of a 48 kDa band (expected molecular weight is 45.6 kDa) corresponding to NAPE-PLD is upregulated 2.4-fold by exposure to 10 μM tBHP. (E,F) Colocalization analysis on image stacks reveals that there is little colocalization between NAPE-PLD and DAPI (Pearson’s R value < 0.20) except for when cells are exposed to 10 μM tBHP, a concentration that increases colocalization to Pearson’s R of 0.20. *p ≤ 0.05.

