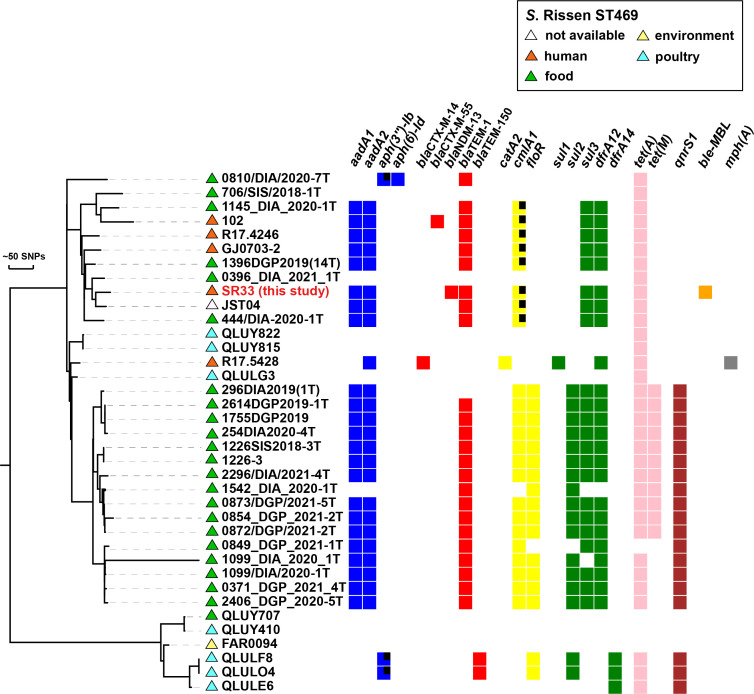
Figure 1.
Phylogenetic distribution of antimicrobial resistance genes of SR33 of this study and other Chinese S. Rissen ST469 isolates. Antimicrobial resistant genes are represented by colored squares, genes with partial deletions are marked with black squares. The source of each isolate is shown with colored triangles. Bars represent unit distance of 50 SNPs.

