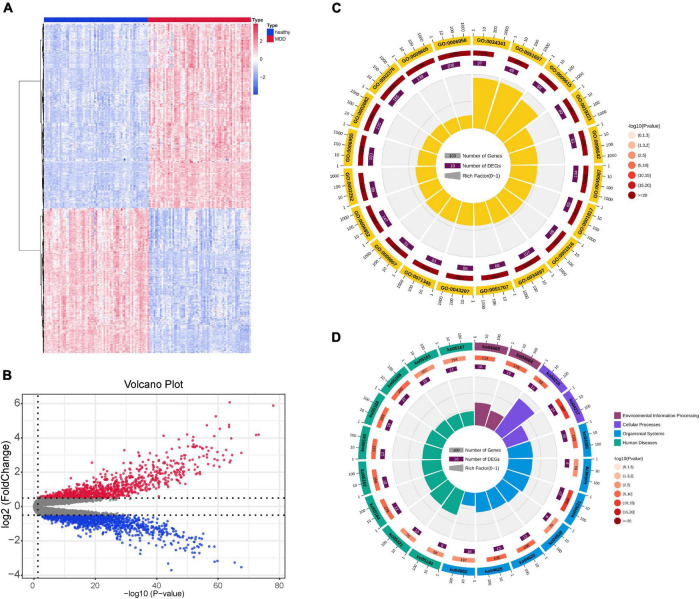
FIGURE 2.
DEG identification of the GSE19738 dataset. (A) DEGs of peripheral blood samples from patients with MDD and healthy controls were obtained from the DEG heat map constructed from the GSE19738 dataset. Horizontal coordinate blue represents the control group, red represents the experimental group, blue indicates low expression, and red indicates high expression. (B) Volcano diagram, black indicates genes with no differential expression, blue indicates down-regulated genes, and red indicates up-regulated genes. (C) GO enrichment analysis. The outer circle represents the number of GO term, the outer circle number represents all genes in GO term, and the inner circle number represents the number of enriched genes. The inner circle pie chart represents the percentage of genes that are enriched. (D) KEGG pathways. The outer circle represents the KEGG ID, the outer circle number represents all genes in the KEGG pathway, and the inner circle number represents the number of genes enriched in the pathway. The inner circle pie chart represents the percentage of genes that are enriched. DEGs, differentially expressed genes; GO, Gene Ontology; KEGG, Kyoto Encyclopedia of Genes and Genomes.

