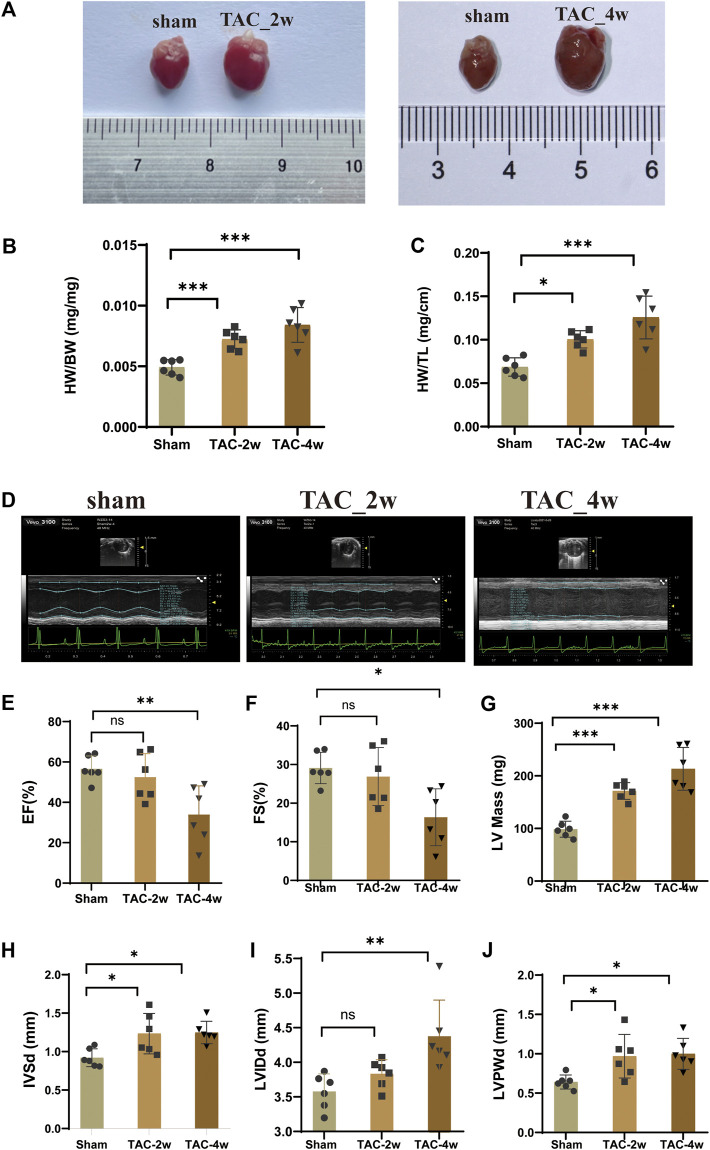
FIGURE 1.
Evaluation of mouse cardiac hypertrophy models. (A) The heart appearance of sham, TAC_2w and TAC_4w group. (B)The heart weight/body weight (HW/BW) significantly increased in TAC2w and TAC4w compared to the sham group. (C)The heart mass/tibia length (HW/TL) significantly increased in TAC2w and TAC4w compared to the sham group. (D) Representative image of an echocardiographic detection of the sham, TAC_2w and TAC_4w. (E–J) Cardiac function indicators (EF, FS, LV mass, LVIDd, LVPWd) measured by echocardiography in sham, TAC_2w and TAC_4w.

