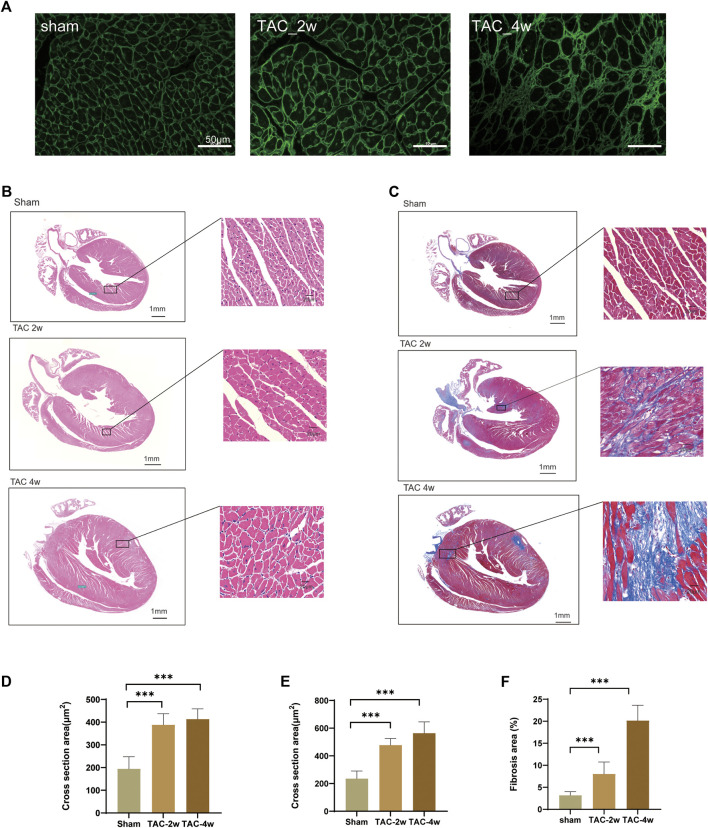
FIGURE 2.
Evaluation of mouse cardiac hypertrophy models. (A,D) Representative WGA images and the statistical result of cross section area of mouse hearts. (B,E) Representative HE images and the statistical result of cross section area of mouse hearts. (C,F) Representative Masson trichrome staining images and the statistical result of fibrosis area mouse hearts. Results are presented as means ± standard error of the mean; ∗ indicates p < 0.05, ∗∗p < 0.01, ∗∗∗p < 0.001. n = 6.

