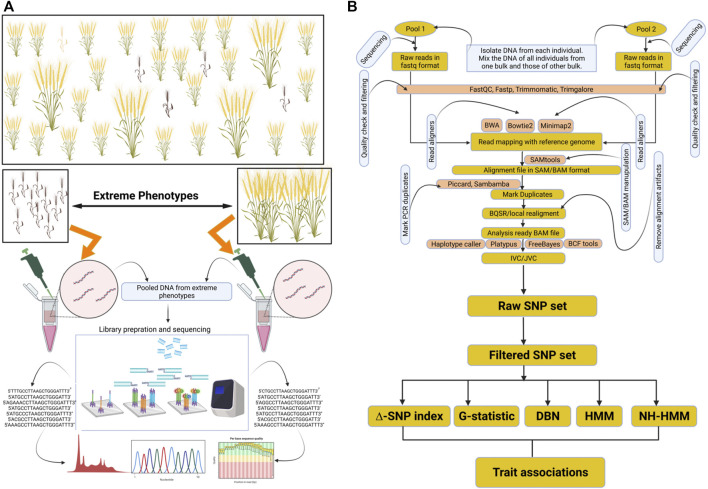
FIGURE 1.
Representation of BSA-seq and general data analysis approach for marker trait associations. (A) depicts the creation of opposite bulks and their sequencing. (B) depicts variant identification and their association with the trait. This figure was created through Biorender https://biorender.com.

