Figure 6.

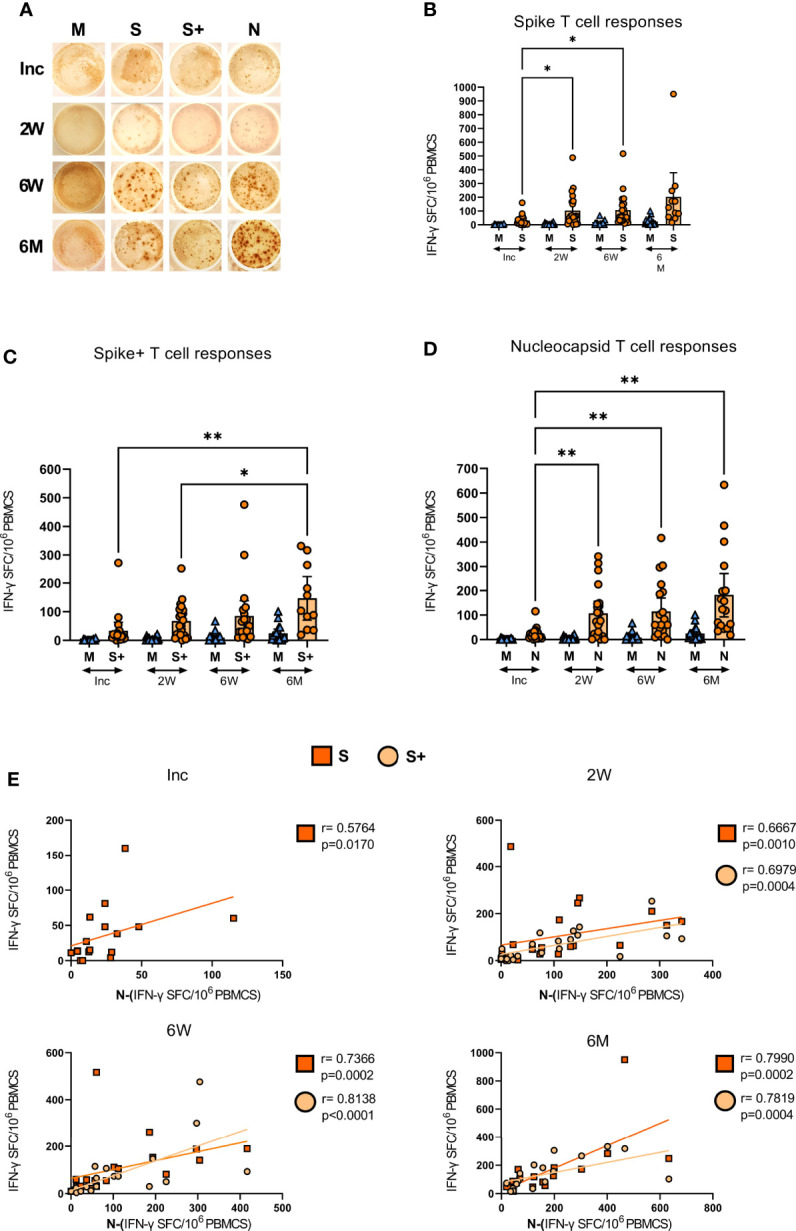
SARS-CoV-2-specific IFN-γ T cell responses in COVID-19 patients. PBMCs collected from COVID-19 patients that needed hospitalization (N=23) were left unstimulated (M) or incubated with SARS-CoV-2-specific peptides: Spike (S), spike+ (S+), and nucleocapsid (N); and assessed for their production of IFN-γ by ELISPOT. (A) Representative images of the IFN-γ production in a COVID-19 hospitalized patient at inclusion, 2 weeks, 6 weeks, and 6-7 months, each dot represents one antigen-specific T cell. Antigen-specific T cell responses as spot forming cells (SFC) per 106 PBMCs, specific for (B) spike, (C) spike+, and (D) nucleocapsid antigens. (E) Bivariate analysis with Spearman’s correlation coefficient was performed on spike, spike+ and nucleocapsid T cell responses with Spearman’s correlation coefficient (R) and p values shown. Data is represented as mean with 95% Cl, with significance of *p ≤ 0.05, **p ≤ 0.01, determined using Brown-Forsythe and Welch ANOVA tests. Inc = Inclusion in study at the hospital, 2W = 2 weeks, 6W = 6 weeks, 6M = 6-7 months, HC = healthy control.
