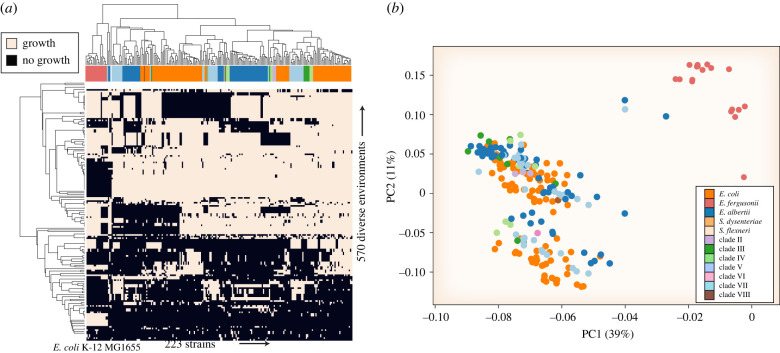
Figure 4.
Model-predicted growth capabilities in 570 different growth-supporting nutritional environments. Growth environments were composed of alternate carbon, nitrogen, phosphorus and sulfur sources). (a) Clustered heatmap of predicted growth is represented by black and no-growth is represented by white. The taxonomic designation for each strain is represented by the horizontal bar at the top of the heatmap with colours corresponding to the legend in panel (b). The common laboratory strain E. coli K-12 MG1655 was included for context. (b) Principal component analysis (PCA) plot of strains based on predicted growth capabilities. Full growth predictions are available in the electronic supplementary material, data file S3.

