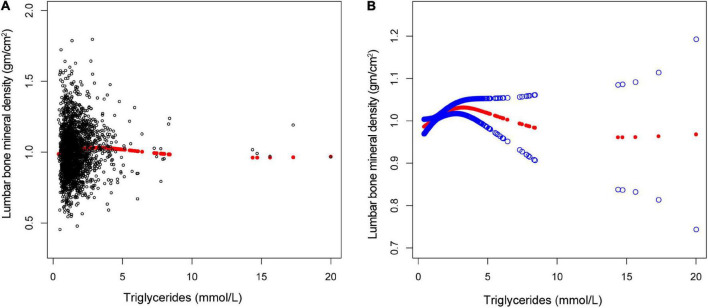
FIGURE 3.
The association between triglycerides and lumbar bone mineral density (BMD). (A) Each black point represents a single participant triglycerides sample. (B) Solid red line represents the smooth curve fit between variables. Blue bands represent the 95% of confidence interval from the fit. Gender, age, race, marital status, alanine aminotransferase, albumin, alkaline phosphatase, bicarbonate, blood urea nitrogen, chloride, creatinine, globulin, glucose, gamma glutamyl transferase, iron, osmolality, phosphorus, sodium, total bilirubin, total calcium, cholesterol, total protein, and uric acid were adjusted.

