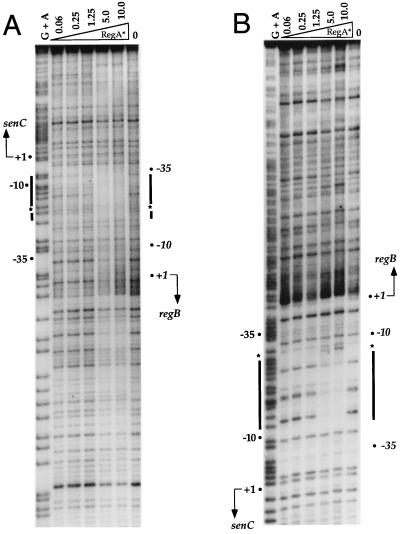
FIG. 4.
DNase I footprint analysis of RegA* protection in the regB and senC-regA-hvrA promoter region. (A) Footprint analysis of the top strand. (B) Footprint analysis of the bottom strand. G+A indicates Maxam-and-Gilbert chemical cleavage patterns. Lanes 2 to 6 are DNase I digestions of binding reaction mixtures containing increasing amounts (in micrograms) of purified RegA*. The binding reaction mixture in lane 7 contains no RegA*. The thick lines delineate regions protected by RegA*, and the asterisks indicate hypersensitive sites. The transcription start sites of regB and senC-regA-hvrA are also indicated.

