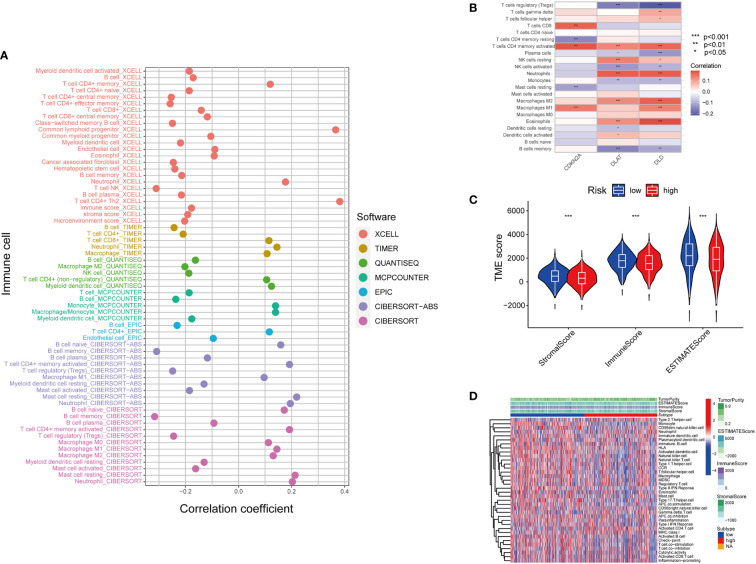
Figure 5.
Inferring the TME of LUAD samples with different cuproptosis statuses. (A) Correlation between cuproptosis gene model and immune cell infiltration inferred by different bioinformatic tools. (XCELL, TIMER, QUANTISEQ, MCPCOUNTER, EPIC, CIBERSORT-ABS, and CIBERSORT.) (B) Correlation between the immune cell infiltration and the differentially expressed cuproptosis-related gene model. (For example, one of the cuproptosis biomarker CDKN2A has a positive correlation with CD8+T cell infiltration, CD4+T cell memory and M1 subtype macrophages.) (C) Correlation between cuproptosis-based risk assessment and TME components. (D) Estimation of TME components and enriched pathways in the high and low-risk groups determined by cuproptosis-related gene model (*, p<0.05; **, p<0.01' ***, p<0.001.

