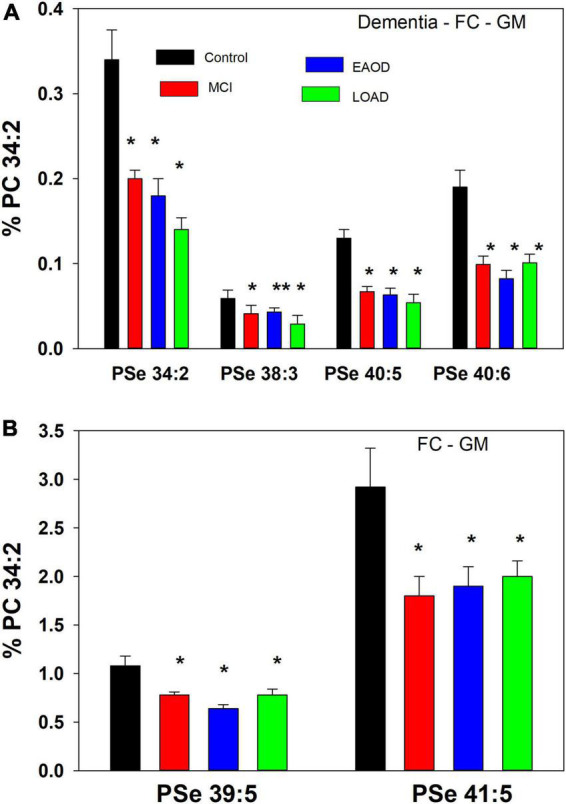
FIGURE 2.

(A) Relative levels of ether (PSe) serine GPL in the frontal cortex gray matter (GM) in controls (black bar), Mild Cognitive Impairment (MCI; red bars), early onset dementia (EOAD; blue bars) and late-onset dementia (LOAD; green bars). *p < 0.01; **p < 0.05. Relative levels are the ratio of the peak intensity of each serine lipid to that of the peak intensity of phosphatidylcholine 34:2 [phosphatidylcholine (PC) 34:2] multiplied by 100 to yield a percentage (Mean ± SEM). (B) Relative levels of ether (PSe) and vinyl-ether (PSp) serine GPL in the frontal cortex white matter (GM) in controls (black bar), Mild Cognitive Impairment (MCI; red bars), early onset dementia (EOAD; blue bars) and late-onset dementia (LOAD; green bars). *p < 0.01. Relative levels are the ratio of the peak intensity of each serine lipid to that of the peak intensity of phosphatidylcholine 34:2 (PC 34:2) multiplied by 100 to yield a percentage (Mean ± SEM).
