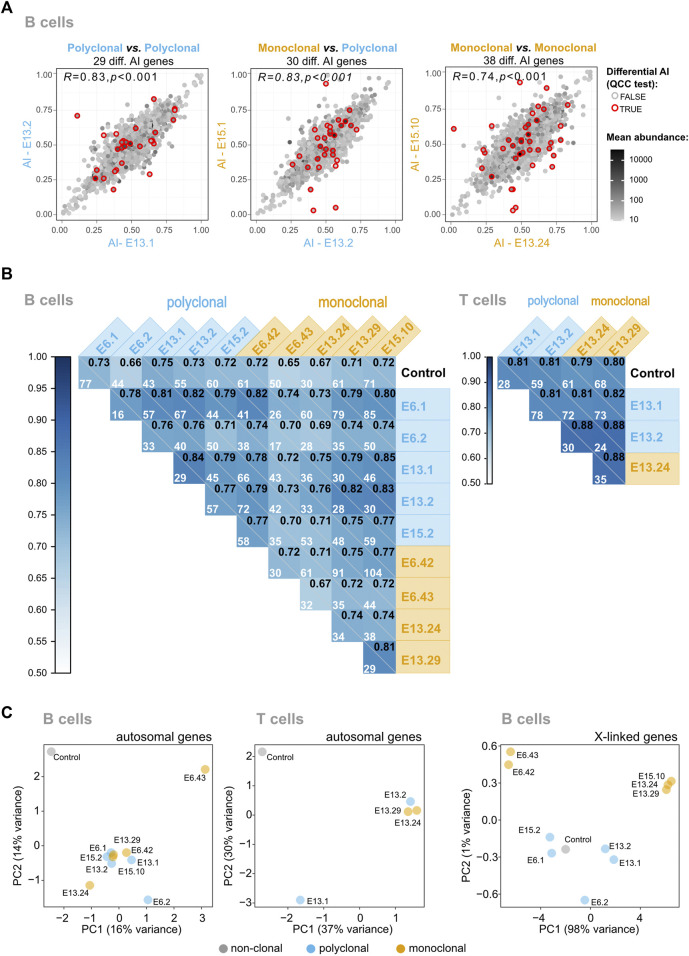
FIGURE 3.
The vast majority of mitotically stable allelic biases of the hematopoietic system are not established during the HSC stage. (A) Representative plots of pairwise AI comparisons (monoclonal vs. polyclonal samples, polyclonal vs. polyclonal samples; and monoclonal vs. monoclonal samples). Red circles signal the genes for which differential AI remained statistically significant after quality control constant (QCC) correction, and the total number of these genes per comparison is shown above each plot. The Pearson’s coefficient correlation for all AI pairwise comparisons is also shown, in the upper left corner of each dot plot. A grayscale coloring the dots represents the mean expression between the two samples, calculated from each sample’s TMM-normalized counts. (B) Correlograms for B and T samples. Pearson’s coefficient correlation of AI for all pairwise comparisons between samples. Within each square, the Pearson’s coefficient is represented in the upper right corner, and the number of genes with a significant differential AI in each pairwise comparison after applying QCC correction on the binomial test is also shown. (C) Visualization of high-dimensional data of autosomal AI in a low-dimensional space using Principal Component Analysis suggests that the monoclonal animals have more variable AI values because of the slightly higher scattering compared to the polyclonal animals, but fails to reveal major differences between the two groups. As a control to show the impact of the AI values in the clustering of the samples in the low-dimensional space, the data from the X-linked genes of the monoclonals were added; as expected, these samples cluster according to the X chromosome (CAST or B6) that is expressed.

