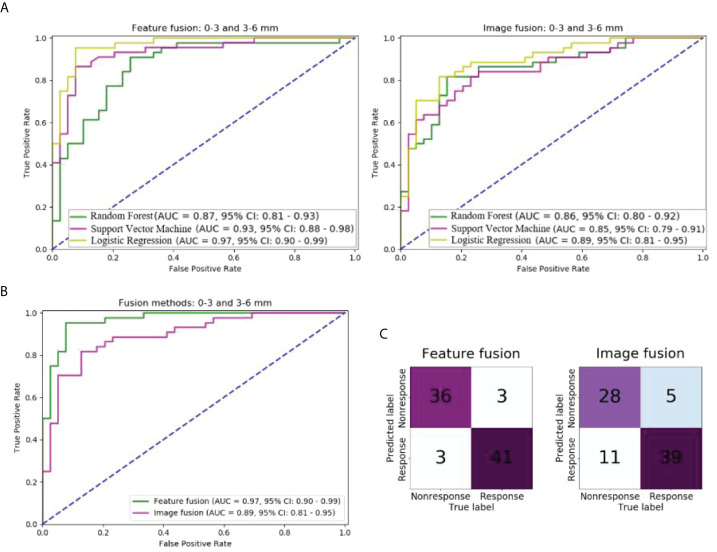
Figure 3.
Comparison of models with different fusion methods of 0–3 and 3–6 mm peritumoral regions in the independent test cohort: (A) ROC curves of models of two fusion methods and three machine learning methods; (B) ROC curves of models of two fusion methods and logistic regression; (C) Confusion matrix of models of two fusion methods and logistic regression.

