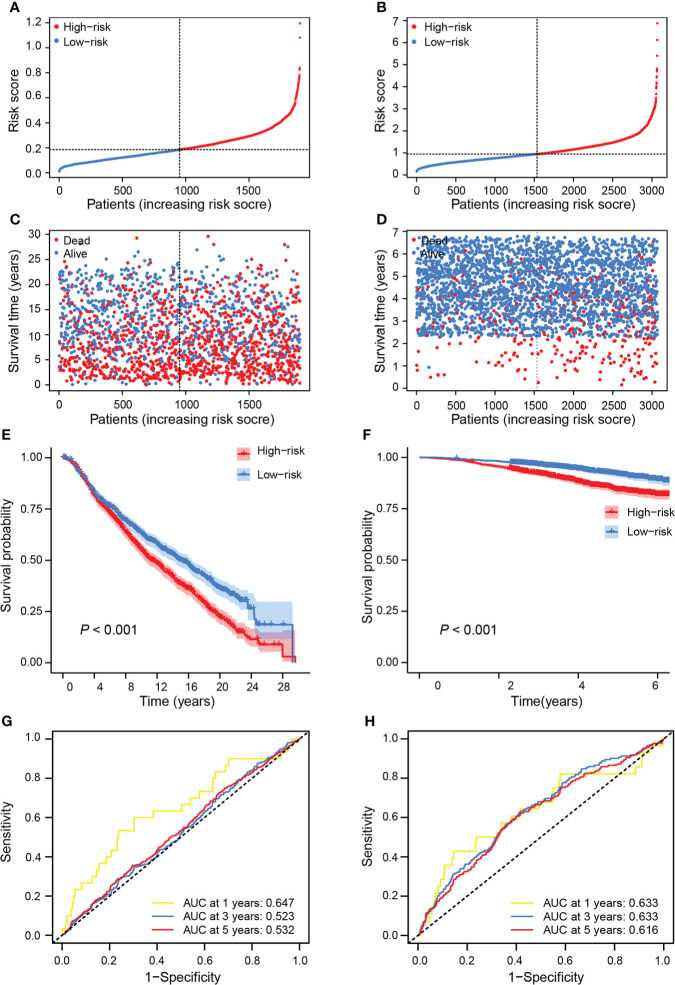
Figure 4.
Validation of the prognostic value of risk score in independent cohorts. Breast cancer patients in the training set were separated into high-risk and low-risk groups based on the median value of risk score in the METABRIC cohort (A) and the GSE96058 cohort (B). Breast cancer patients’ survival status and risk score distribution in the METABRIC cohort (C) and the GSE96058 cohort (D). Kaplan–Meier curves of OS between the high-risk and low-risk groups in the METABRIC cohort (E) and the GSE96058 cohort (F). ROC curves showed the performance of risk score in predicting the 1-, 3-, and 5-year OS in the METABRIC cohort (G) and the GSE96058 cohort (H).

