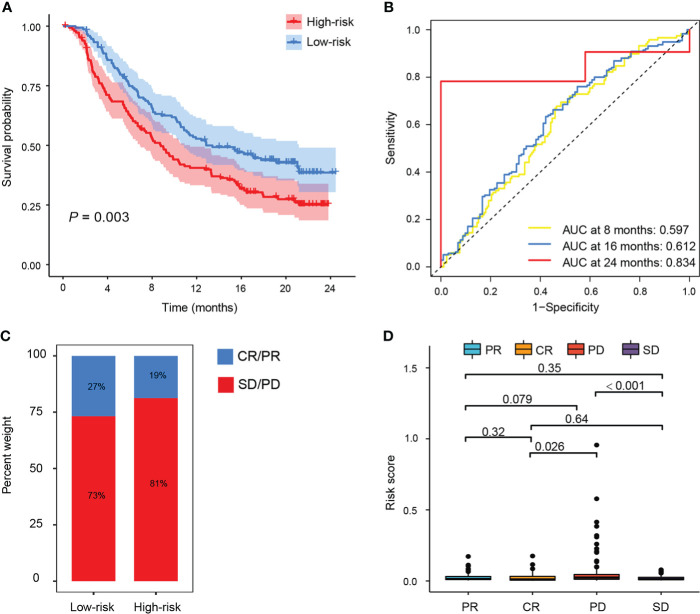
Figure 6.
The prognostic value of PTS in patients with anti-PD-L1 therapy. (A) Kaplan–Meier curves of OS between the high-risk and low-risk groups in the IMvigor210 cohort. (B) ROC curves showed the performance of the risk score in predicting the 8-, 16-, and 24-month OS in the IMvigor210 cohort. (C, D) Risk score in patients with different responses to PD-1 treatment [complete response (CR), progressive disease (PD), partial response (PR), and stable disease (SD)].

