Figure 3.
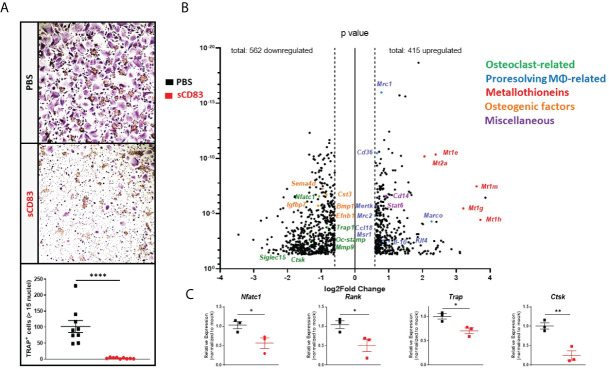
sCD83 treatment blocks osteoclast formation from human-derived peripheral blood mononuclear cells. (A) Representative image (A; upper side) used for the quantification of large multinucleated TRAP+ cells with more than 15 nuclei (A; lower side) with n = 9. (B) Volcano plot of RNA sequencing analyses of sCD83- vs. PBS-treated osteoclasts from healthy donors on day 7, derived from three independent donors per condition. The dots depicted on the right-hand side of the log2Fold change 0 value represent significantly upregulated gene transcripts, while the dots on the left-hand side represent significantly downregulated transcripts with log2FC ≥0.6, respectively. Specific dot colors classify the transcripts into characteristic groups: green = osteoclast-related, blue = transcripts associated with alternatively activated M2-like MΦ, red = metallothioneins, orange = transcripts which are associated with osteoblast formation, and purple = miscellaneous transcripts, with a prominent effect on monocytes, MΦ, or osteoclasts. (C) Verification of the RNA sequencing data by RT-PCR analyses regarding the expression of osteoclast-related transcripts from one representative experiment (n = 3). (A) Mann–Whitney test and (C) Student’s t-test. Asterisks mark the statistically significant differences (*p < 0.05, **p < 0.01, ***p < 0.001, and ****p < 0.0001).

