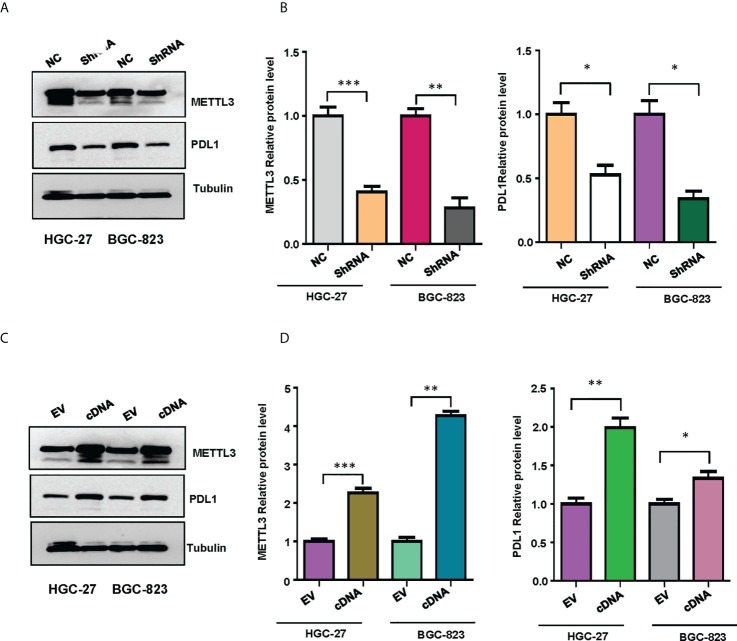
Figure 10.
The expression of METTL3 and PD-L1 in gastric cancer cells was illustrated. (A), Western blotting was performed to measure the expression of METTL3 and PD-L1 in HGC-27 and BGC-823 cells after METTL3 downregulation. (B), Quantitative data were shown for panel (A). (C), Western blotting was performed to measure the expression of METTL3 and PD-L1 in HGC-27 and BGC-823 cells after METTL3 overexpression. (D), Quantitative data were shown for panel (C). *p<0.05; **p<0.01; ***p<0.001.

