
Figure 4.
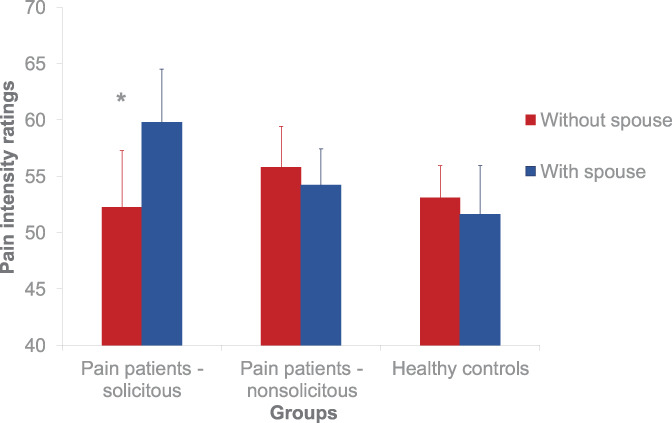
Pain intensity ratings. The figure shows the mean ratings of the painful stimulation for the 3 groups (healthy, patients with a solicitous spouse, and patients with a nonsolicitous spouse) and the 2 conditions (with and without spouse). *P < 0.05.