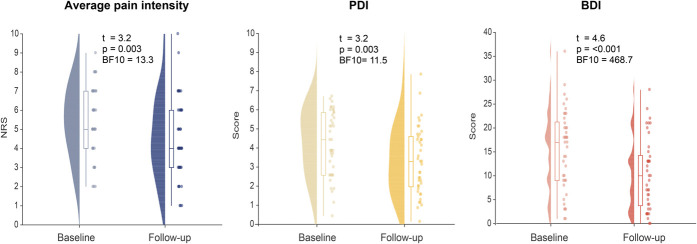
Figure 2.
Clinical measures at baseline and follow-up. Measures of average pain intensity on the Numerical Rating Scale (NRS) as well as scores for pain-related disability (Pain Disability Index [PDI]) and depression (Beck Depression Inventory II [BDI]) at baseline and follow-up are depicted. Raincloud plots show unmirrored violin plots displaying the probability density function of the data, boxplots, and individual data points. Boxplots depict the sample median as well as first (Q1) and third quartiles (Q3). Whiskers extend from Q1 to the smallest value within Q1 −1.5* interquartile range (IQR) and from Q3 to the largest values within Q3 +1.5* IQR.

