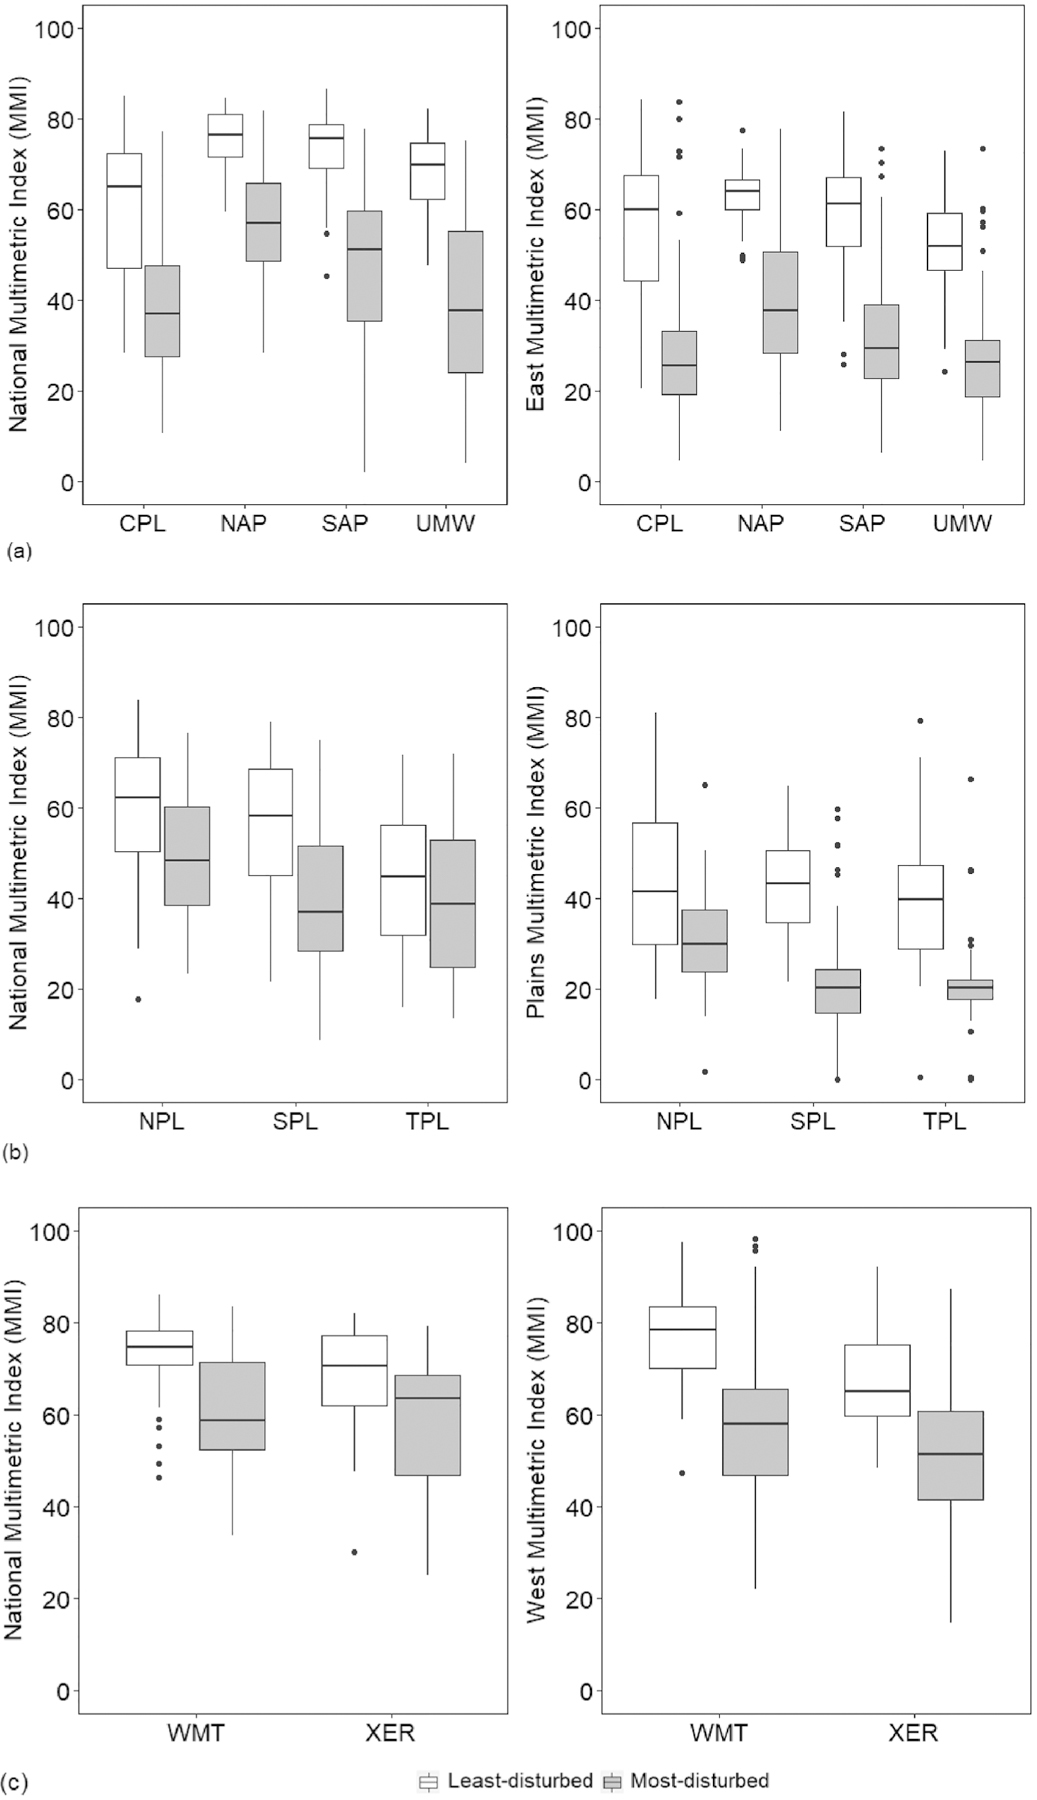
Fig. 2.

Boxplots comparing the discrimination between least- and most-disturbed site scores for the national MMI and ecoregion-specific MMIs within each of the component ecoregions (a) the East, (b) the Plains, and (c) the West, based on the calibration data (2008–2009 NRSA). Refer to Table 1 for a description of the x-axis ecoregion acronyms. Horizontal lines represent the medians, boxes represent the interquartile ranges (25th and 75th percentiles), whiskers represent 5th and 95th percentiles, and the dots represent outliers.
