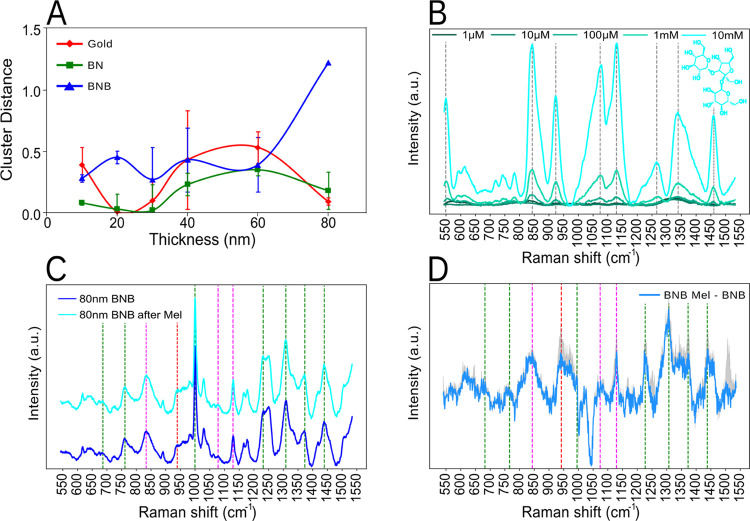
Figure 3.
(A) Euclidian distance for the different PCA clusters between the prior to and post-melezitose submersion for gold, benzyl-terminated SAM (BN), and benzoboroxole-terminated SAM (BNB) for various thicknesses. The most significant separation is observed for the 80 nm thickness on BNB. (B) Raman spectra for different concentrations (0.001–10 mM) of melezitose (on aluminum) with the relevant peaks of melezitose highlighted by a gray dotted line. (C) Average Raman spectrum of BNB before and after melezitose submersion for the 80 nm gold thickness. (D) BNB Raman spectra difference between before and after melezitose at 80 nm gold, with the standard deviation outlined. Common peaks between the BNB and BNB after melezitose (green) melezitose, BNB and BNB after melezitose (magenta) and melezitose and BNB after melezitose (red).

