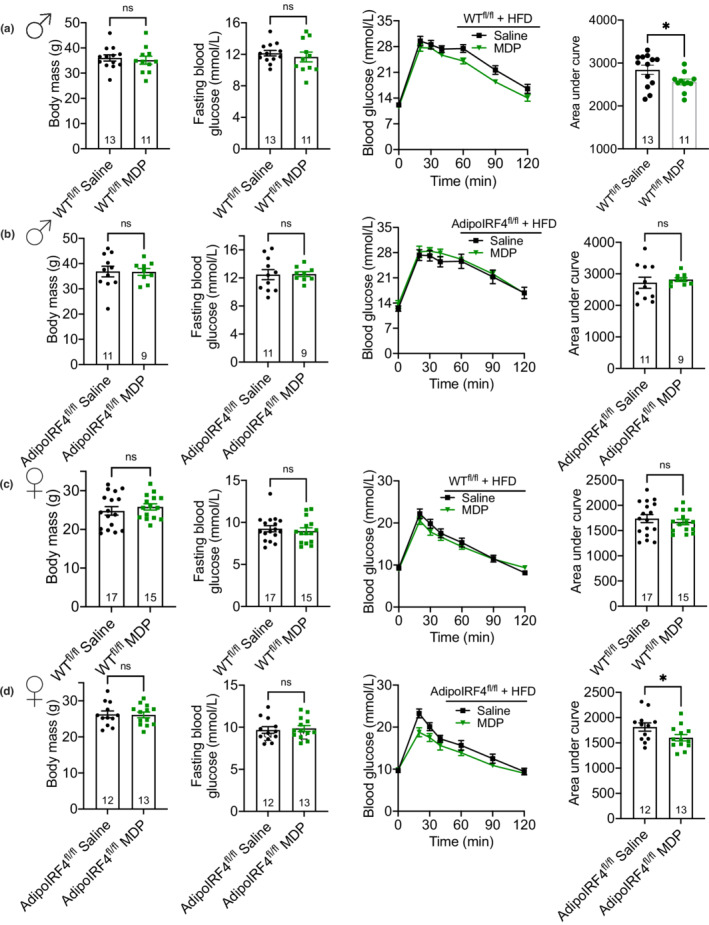
FIGURE 2.

Adipocyte IRF4 dictates a sex‐specific glucose response to MDP during obesity. Body mass, FBG, blood‐glucose vs. time and area under the blood glucose curve during a GTT (1.5 g/kg, i.p.) in (a) male WTfl/fl, (b) male AdipoIRF4fl/fl, (c) female WTfl/fl and (d) female AdipoIRF4fl/fl mice fed a 60% HFD and injected with saline or MDP (100 μg, i.p, 4d/wk) for 4 weeks (n = 11‐17/group). Each dot is a separate mouse.
