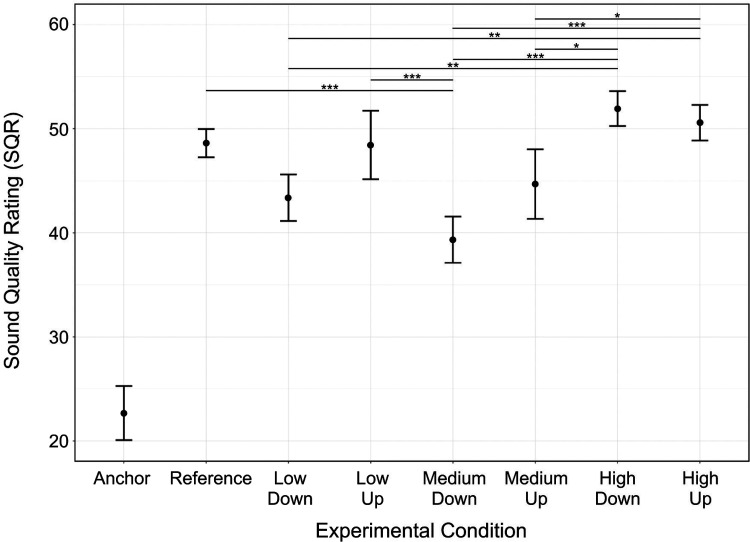
Figure 5.
Impact of FRM on MUSHRA ratings. Each dot represents within-participant (n = 33) averages across each condition type. Error bars show ±1 standard error from the mean. The Anchor is significantly different from all conditions (p < 0.001); these horizontal lines indicating significant differences are omitted for figure clarity. *p < 0.05, **p < 0.01, ***p < 0.001. Abbreviations: Hz, hertz; MUSHRA, Multiple Stimuli with Hidden Reference and Anchor.

