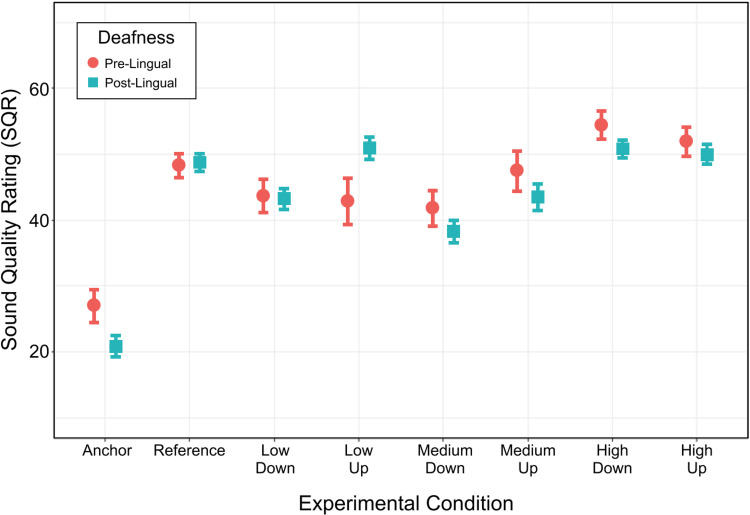
Figure 7.
Impact of pre- versus post-lingual deafness on SQR. Participants were split into two groups: those who were pre-lingually deafened (n = 10) and those who were post-lingually deafened (n = 23). Each dot represents within participant averages for a given condition. Error bars show ±1 standard error from the mean.

