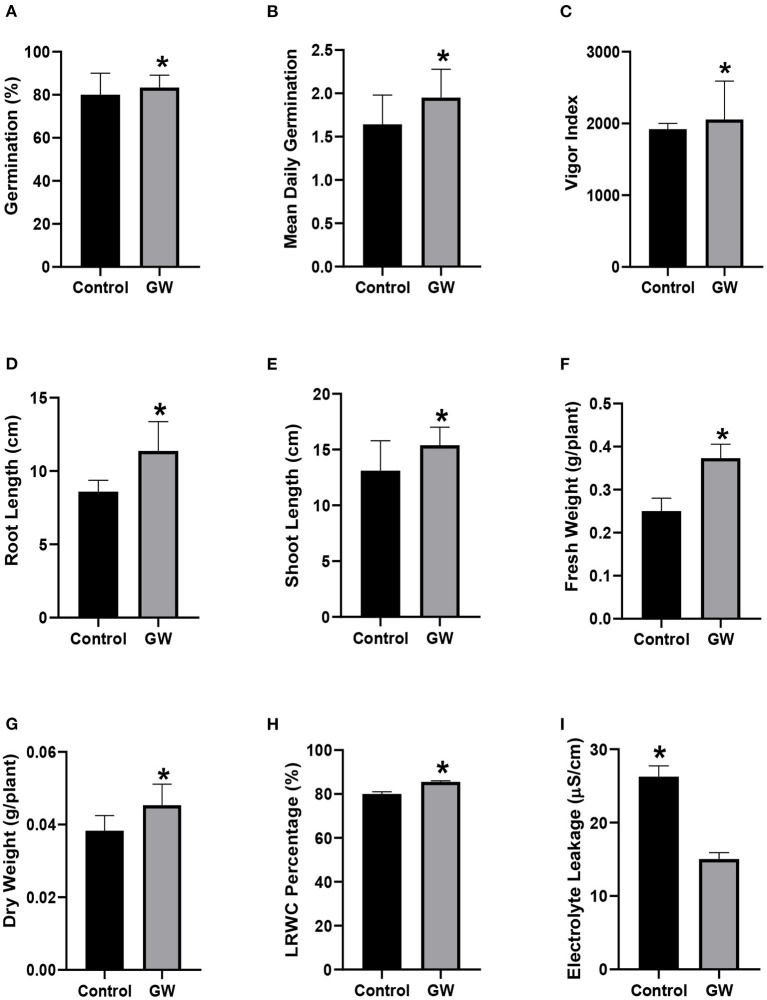
Figure 9.
Wheat biofertilization by F. oxysporum GW (A) germination percentage, (B) mean daily germination, (C) vigor index, (D) root length, (E) shoot length, (F) fresh weight, (G) dry weight, (H) LRWC, and (I) EC. Bars show the mean of three replicates with standard deviation. Bars labeled with * are significantly higher (t-test; p < 0.05).

