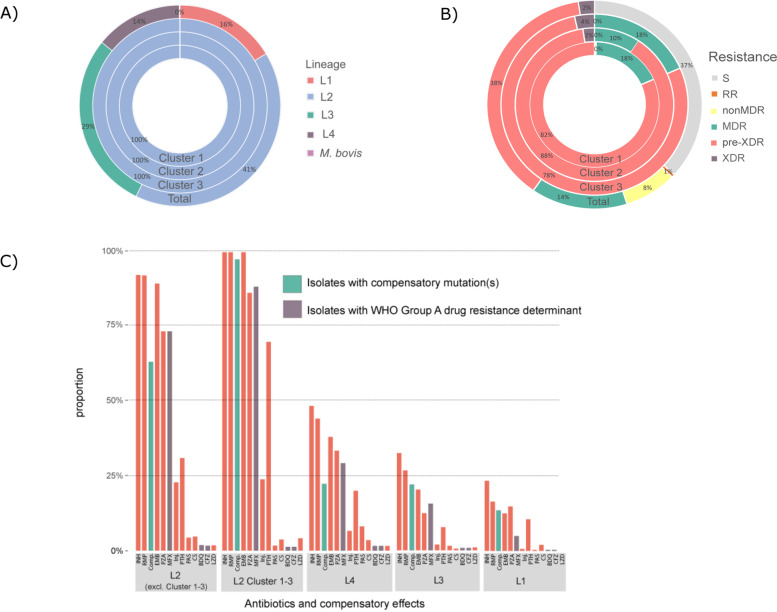
Fig. 2.
Genotype and resistance category distribution of strains across 1852 clinical isolates (Total) and within the three major clusters. A Distribution of resistance category across the 1852 isolates; resistance categories are RR (rifampicin resistant), nonMDR (resistant, but not multi drug resistant [MDR]), MDR, pre-XDR (pre-extensively drug resistant), and XDR (extensively drug resistant); of the total strain population, about 37% are susceptible (S) to all drugs, 38% of strains are pre-XDR whereas 2.4% are XDR in the cohort. The resistant category distribution of clusters 1, 2, and 3 differs, with all strains being at least MDR). B Proportion of strains with known resistance mutations per lineage. Each bar represents a specific antibiotic or compensatory effect. L2 strains, especially the ones from clusters 1–3, have the highest proportion of resistance mutations and also compensatory effects. Abbreviations: INH, isoniazid; RMP, rifampicin; Comp., compensatory mutation; EMB, ethambutol; PZA, pyrazinamide; MFX, moxifloxacin; Inj., injectables; PTH, prothionamide; PAS, para-aminosalycilic acid; CS, cycloserine; BDQ, bedaquiline; CFZ, clofazimine; LZD, linezolid; L1, Lineage 1; L2, Lineage 2; L3, Lineage 3; L4, Lineage 4

