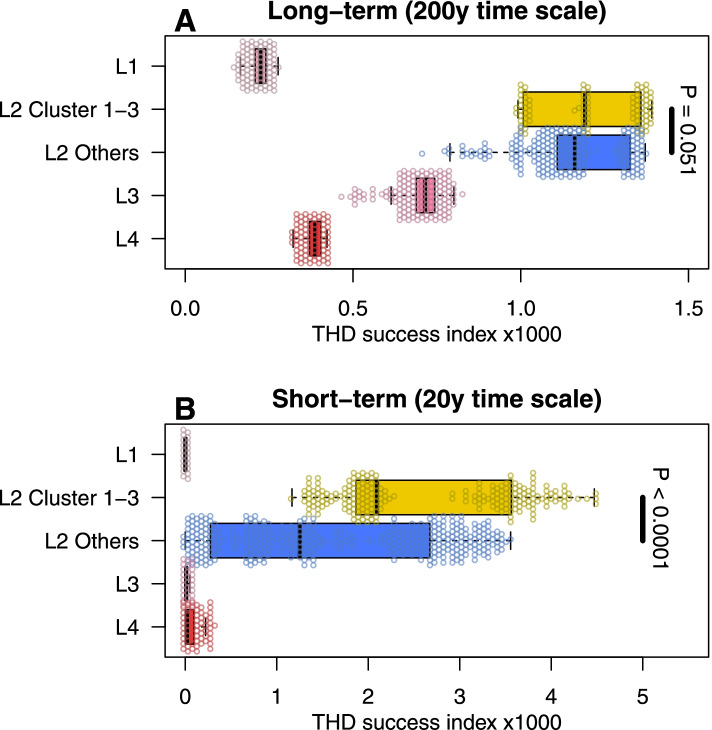
Fig. 5.
MTBC lineage 2 exhibits greater epidemic success than Lineages 1, 3, and 4. Shown are boxplots and distribution of THD success indices in MTBC Lineages 1–4, with Lineage 2 split into clusters 1–3 and other strains. THD success indices were larger in Lineage 2 compared with other lineages, using both a long-term (A) and a short-term (B) analysis time scale. Within Lineage 2, clusters 1–3 had similar long-term success as other strains over a long-term time scale (A) but had superior success in the short-term (B), suggesting that strains from clusters 1–3 became successful only recently. P-values obtained from 2-sided Mann–Whitney U test

