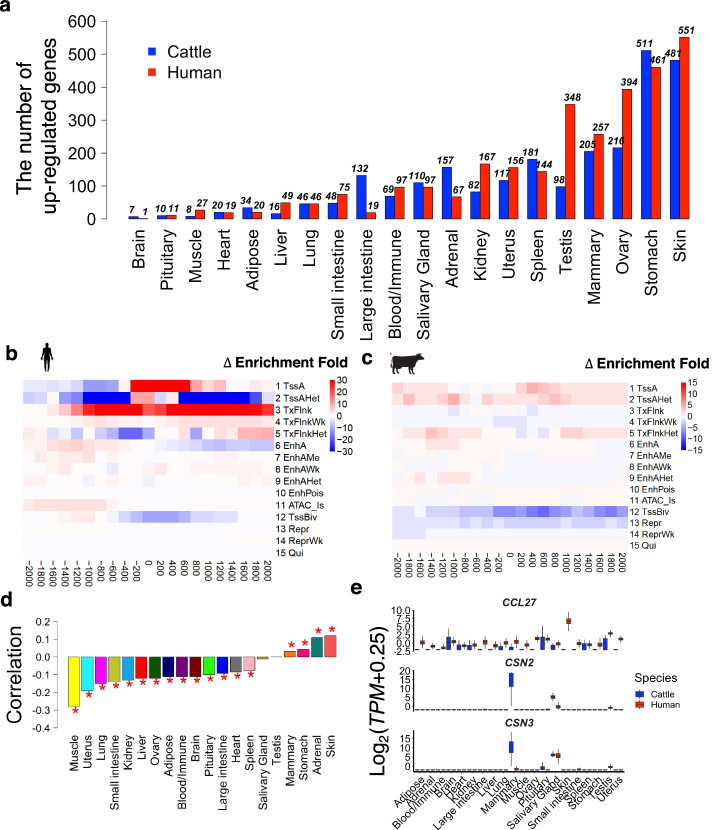
Fig. 3.
Comparison of average gene expression across 20 tissues between humans and cattle. a Number of significantly upregulated genes across tissues in humans (red) and cattle (blue) using the cutoff of fold-change (FC) > 1.2 and FDR < 0.05. b, c Changes of enrichment folds of 15 chromatin states around (± 2kb) transcriptional start sites (TSS) of top 500 upregulated genes in human and cattle adipose when compared with each other, respectively. The 15 chromatin states are predicted based on six epigenetic marks (i.e., ATAC, CTCF, H3K27ac, H3k27me3, H3K4me1 and H3K4me3). d Spearman’s correlation of genes between their tissue specificity (measured by −log10p from tissue specificity expression analysis) of expression and degrees (−log10p) of differential expression between species. “*” represents the correlation coefficient is significant (FDR < 0.01). e Expression profiles of CNS2, CNS3, and CCL27 across human (red) and cattle (blue) tissues

