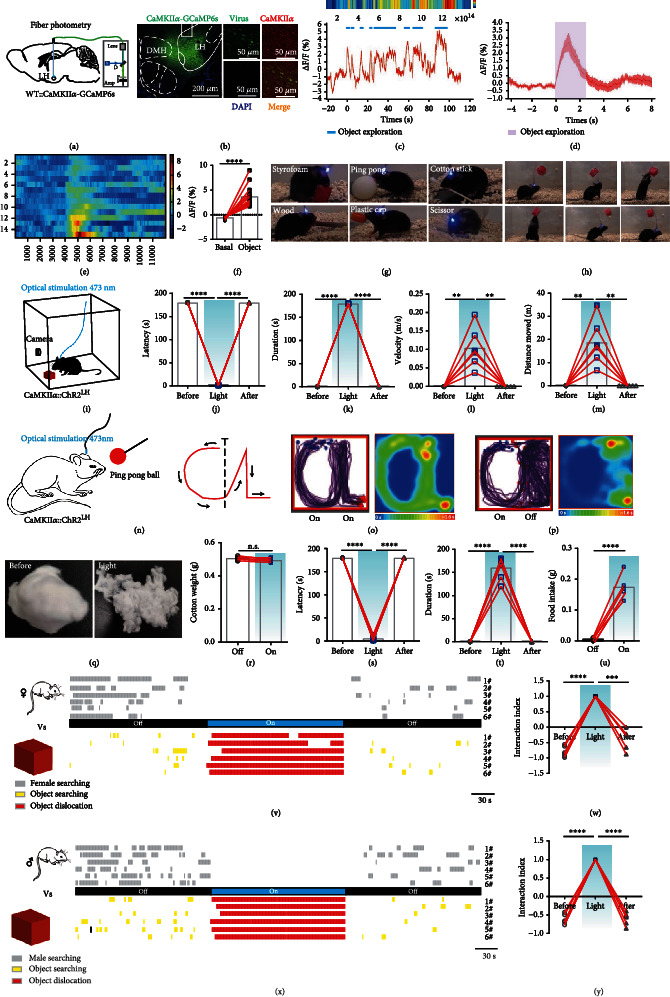
Figure 1.

LH CaMKIIα+ neurons encode novelty-seeking signals in object exploration. (a) Schematic image of fiber photometry. (b) Left, representative image of AAV-CaMKIIα-GCaMP6s virus and optical cannula position, scale bar, 200 μm; right, colocalization of the AAV-CaMKIIα-GCaMP6s virus (green) and immunostaining of CaMKIIα (red), scale bar, 50 μm. (c) Representative single raw neuronal activity and heat map when mice interacted with novel object. (d) Mean calcium activities of 5 mice (each mouse was repeated for three times). The purple area indicated the exploration process, and the error bar indicated SEM of all trials. (e) Heat map of fluorescence of 5 mice. (f) Quantification of fluorescence changes (n = 5; paired t-test, ∗∗∗∗P < 0.0001). (g) CaMKIIα::ChR2LH mice showed active interaction with different objects. (h) Mouse was leaping and reaching out to a hanging object. (i) Schematic of optogenetics and video record. (j–m) Effect of optical stimulation of CaMKIIαLH neurons on object exploration behavior: latency to initiate retrieve an object (j), duration of object dislocation and biting (k), average velocity of object dislocation (l), and distance moved when retrieving an object (m) (n = 6, one-way ANOVA followed by Dunnett's post hoc test, ∗∗∗∗P < 0.0001, ∗∗P < 0.01). (n–p) Effects on chasing a moving ball: schematic illustration of chasing experiment (n); cumulative traces and mean heat map with constant light delivery (o); and cumulative routes and mean heat map, the light was withdrawn after finishing contour “C” (p). (q–t) Effect of biting a cotton ball: representative cotton ball images (q), cotton weight (r), latency of biting (s), and duration of biting (t) (n = 6, one-way ANOVA followed by Dunnett's post hoc test, ∗∗∗∗P < 0.0001). (u) Food pellet consumption in 3 min (n = 6, paired t-test, ∗∗∗∗P < 0.0001). (v) Behavioral raster plots illustrated synchronous interaction with a Styrofoam cube and a female mouse. (w) The interaction index (n = 6; one-way ANOVA followed by Dunnett's post hoc test, ∗∗∗∗P < 0.0001, ∗∗∗P < 0.001). (x) Behavioral raster plots with a Styrofoam cube and a younger male mouse. (y) Interaction index (n = 6, one-way ANOVA followed by Dunnett's post hoc test, ∗∗∗∗P < 0.0001).
