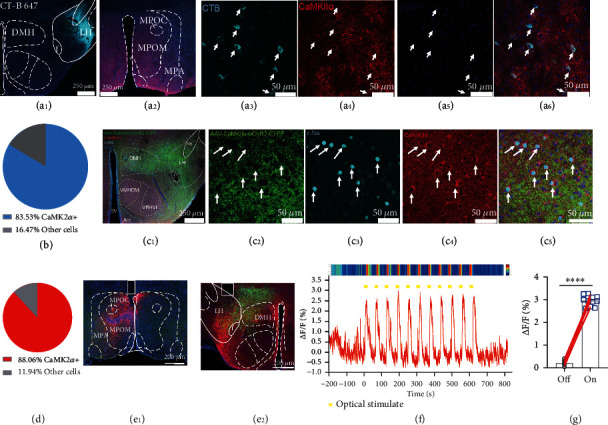
Figure 4.

The LH CaMKIIα+ neurons are directly modulated by MPOA CaMKIIα+ neurons.(a1–a6) Retrograde tracing of LH. Representative image of CT-B 647 in LH, scale bar, 250 μm (a1); representative image of retrograde soma in MPOA, scale bar, 250 μm (a2); the enlarged view of CT-B tracing neuronal soma in MPOA (a3); immunostaining of CaMKIIα (a4); DAPI (a5); and colocalization (a6). (b) Percentage of CaMKIIα+ neurons accounts for all CT-B tracing neurons. (c1–c5) MPOA-LH function connection identification. Representative image of CaMKIIαMPOA-LH projection (green) and immunostaining of Fos (cyan) and CaMKIIα (red) after optical stimulation, scale bar, 250 μm (c1); the enlarged images of ChR2-EYFP expression (c2); immunostaining of c-Fos (c3); CaMKIIα (c4); and their colocalization (c5), scale bar, 50 μm. (d) The percentage of CaMKIIα+ neurons accounted for all immunolabeled Fos+ neurons. (e1) Representative image of CaMKIIα::ChrimsonRMPOA, scale bar, 200 μm. (e2) Representative image of CaMKIIα::GCaMP6sLH (green), scale bar, 200 μm. Red color indicates ChrimsonR-mCherry projection. (f) Representative raw trace and heat map of the fluorescence signal of LH CaMKIIα+ neurons corresponding to MPOA CaMKIIα+ neuron activation; yellow bars indicate each optical stimulation. (g) Average GCaMP signal of all trials aligned to the optical stimulation (paired t-test, ∗∗∗∗P < 0.0001).
