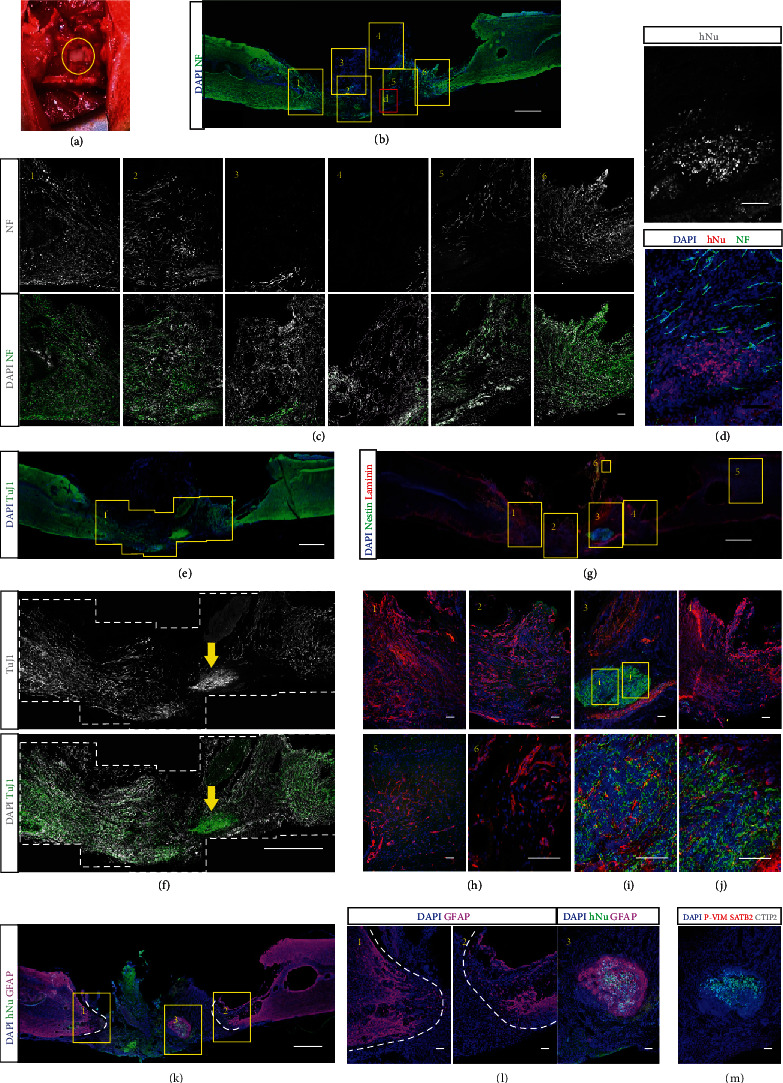
Figure 5.

Transplantation of human iPSC-derived cerebral organoids into the transected spinal cord. (a) A large cerebral organoid (~5 mm in diameter) was inserted into the space where 5 mm long spinal cord tissue had been cut and removed. (b–d) Confocal sagittal images of the cryosection of a spinal cord tissue 8 weeks after receiving the organoid transplantation. Images 1, 2, 3, 4, 5, and 6 of (c) are the enlarged views in (b), showing the distribution of axons (NF, green) and nuclei (DAPI). The boxed area (d) in red is magnified, which shows the aggregation of human cells marked by human nuclear antigen (hNu) (d). (e, f) Confocal sagittal images of the immunostaining of the pan-neural marker TuJ1. The enclosed area in (e) is enlarged in (f). Yellow arrows indicate the position of the human cell aggregate. (g–j) Immunostaining images of Laminin, indicative of possible angiogenesis, and Nestin, indicative of neural stem cells, of the spinal cord tissue with an implanted cerebral organoid. The images 1-6 in (h) are the enlarged areas in (g). The boxed areas in 3 in (h) are magnified in (i) and (j) to show the detailed distribution of Laminin and Nestin. (k, l) Confocal images show the distribution of hNu, GFAP, and SATB2, indicative of human cells, astrocytes, and surface cortical neurons, respectively. The enlarged areas in (k) are shown in (l) and (m). The distributions of GFAP+ cells (astrocytes) are shown in 1 and 2 in (l), while the human cell cluster labeled by hNu is shown in 3 in (l). The significant signals of SATB2 are observed within the human cell cluster, but those of P-VIM and CTIP2 are found to be scarce (m). Scale bars, 100 μm (c, d, h, i, j, l, m) and 1 mm (b, e, f, k).
