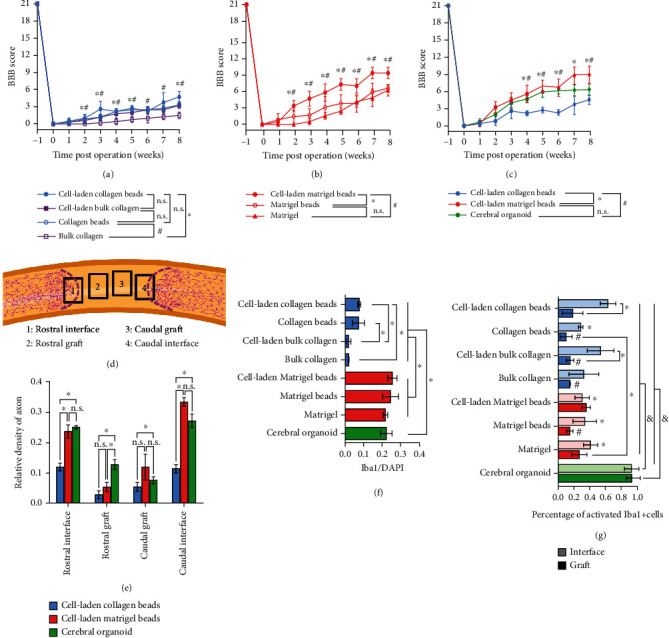
Figure 7.

Quantification of the locomotor function recovery, neuronal regeneration, and abundance of immune cells. (a) The locomotor behavior of the collagen-based materials in the form of col-DNA beads and bulk gel, either cell-laden or acellular, is accessed via Basso, Beattie, and Bresnahan (BBB) locomotor scale method. Unpaired two-tailed Student's t-test was applied (n ≥ 5/group). (b) The locomotor function recovery of the transplantation of the Matrigel-based materials in the form of cell-laden beads, acellular beads, and liquid Matrigel. Unpaired two-tailed Student's t-test was applied (n ≥ 5/group). (c) The BBB locomotor scores are compared within the groups transplanted with cell-laden collagen beads, cell-laden Matrigel beads, and a cerebral organoid. Unpaired two-tailed Student's t-test was applied (n ≥ 3/group). (d) Schematic indicates the areas used to quantify neuronal regeneration at the rostral interface of the graft and the host tissues (1), the rostral part of the graft (2), the caudal part of the graft (3), and the caudal interface of the graft and the host tissues (4). The magenta dot lines indicate the boundaries of the GFAP+ cells from the host tissue, showing the interfaces between the host tissue and grafts. (e) Quantification of the signal density of axons within the four areas among the cell-laden collagen beads, cell-laden Matrigel beads, and cerebral organoid transplantations. Paired two-tailed Student's t-test was applied (n = 3/group). (f) Quantification of the Iba1+ cells within the grafts. Paired two-tailed Student's t-test was applied (n = 3/group). (g) Quantification of the activated Iba1+ cells among all the Iba1 cells within the regions of interfaces and grafts. ∗ above the columns represents the significant differences when comparing the “interface region” with the group of “cell-laden collagen beads”, while other ∗ represents the significant differences between the indicated columns. # above the columns represents the significant differences when comparing with the “grafts” region of the group of “cell-laden Matrigel beads”. & above the columns of the group of “cerebral organoid” indicates the significant differences when compared with all other columns. ∗, #, and & represent the p value < 0.05 in (a, b, c, e, f, g), and the n.s. represents no statistically significant difference. Data are represented as means ± SDs.
