
Figure 4.
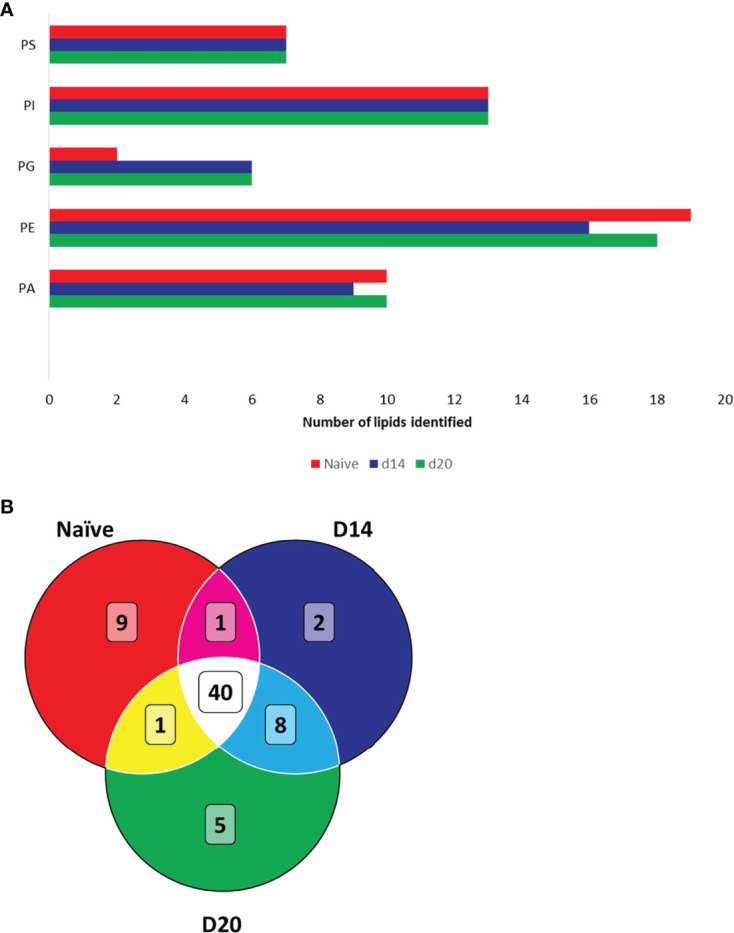
Structural identification of lipids using FTMS. (A) Lipids identified in naïve and infected mouse liver. Bar chart displays the total number of identified lipids per lipid class. (B) Venn diagram showing overlap of identified lipids in naïve and infected liver. Phosphatidic acids (PA), phosphatidylethanolamines (PE), phosphatidylinositols (PI), phosphatidylserines (PS) and phosphatidylglycerols (PG). Lipids are detailed in Table S1.