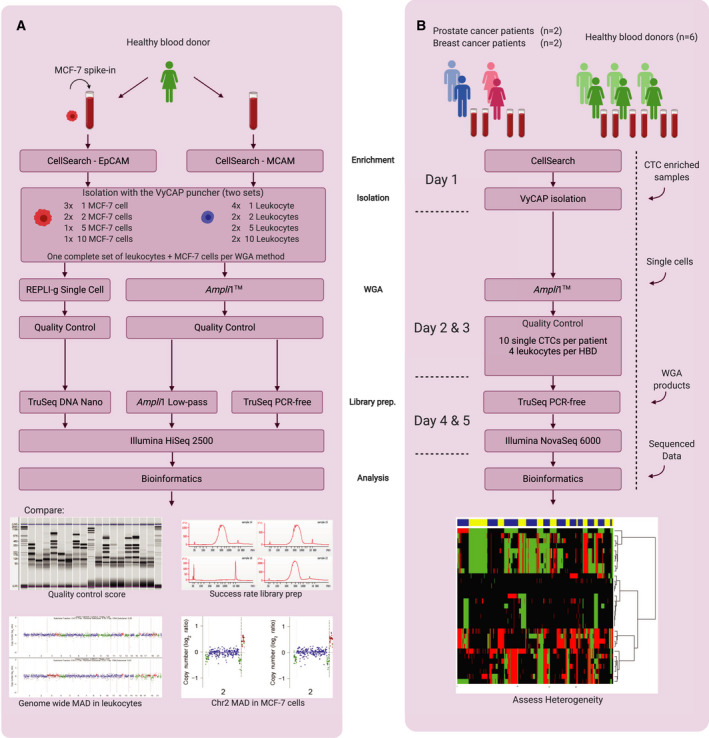
Fig. 1.

Schematic workflow of pipeline optimization and validation on clinical samples. (A) Workflow for determining the optimal WGA method and library preparation method. (B) Validation of the optimal pipeline to obtain a single‐cell control panel from HBDs and CN profiles from single CTCs. Workflow in days is indicated on the left. The arrows on the right represent entry points after alternative methods. MAD, median absolute deviation.
