
Fig. 1.
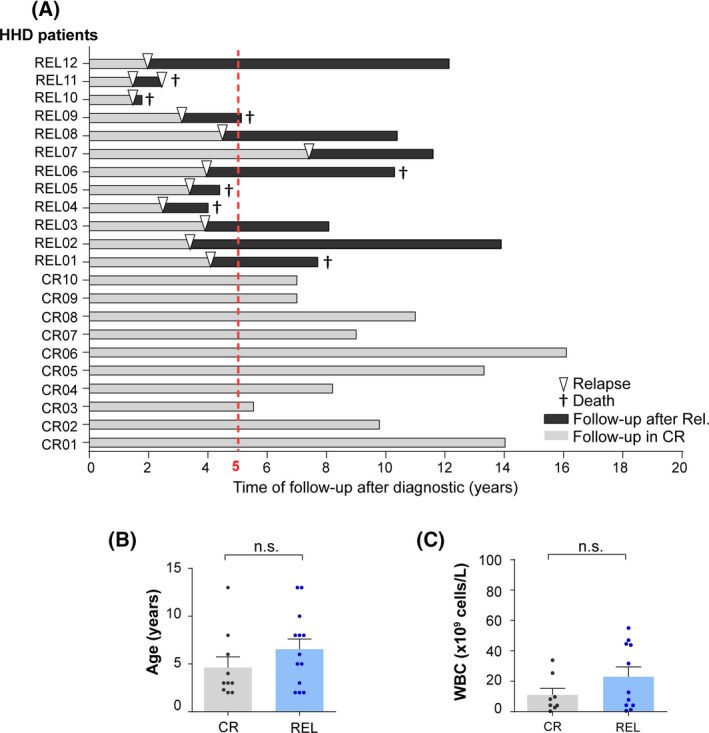
Clinical outcome and biological features of the high‐hyperdiploid B‐cell acute lymphoblastic leukemia (HHD‐B‐ALL) patients analyzed by seq‐iFISH. (A) Time of follow‐up after diagnosis (DX) of the HHD‐B‐ALL patients analyzed by seq‐iFISH. Complete remission (CR) denotes those patients who remained disease‐free after a minimum of 5 years of follow‐up after treatment denoted as a dashed red line (n = 10). Relapse (REL) denotes those patients who relapsed within this timeframe (except one patient who relapsed after 7 years; n = 12). Light and dark gray bars represent follow‐up in CR and after relapse, respectively. Arrow heads depict the time of relapse. † denotes patient's death. (B,C) age (B) and WBC (C) of CR and REL patients. Bars represent the mean values of each group and the error bars represent the standard error of the mean (SEM). Each dot represents an individual patient. Two‐sided unpaired t‐test. [Colour figure can be viewed at wileyonlinelibrary.com]