
Fig. 2.
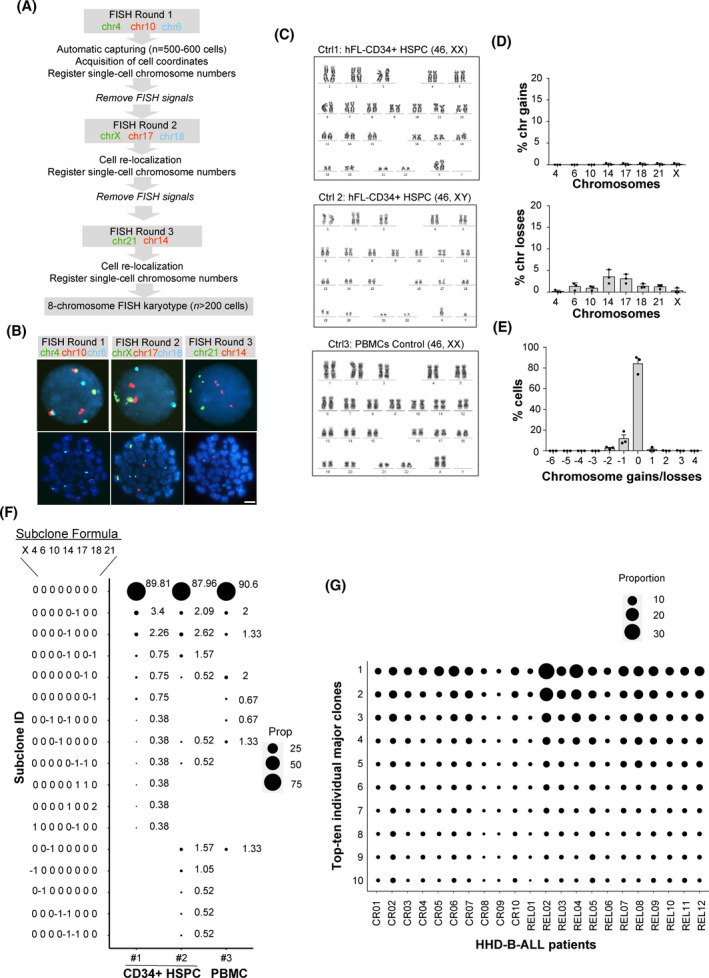
Reliability of the seq‐iFISH analyses employed for detection of clonal heterogeneity in high‐hyperdiploid B‐cell acute lymphoblastic leukemia (HHD‐B‐ALL). (A) Scheme depicting the seq‐iFISH stepwise analysis. (B) Representative images of consecutive FISH rounds using the indicated chromosomes in the same cell. Top and bottom panels show interphase and metaphase cells, respectively. Scale bar = 10 μm. (C) Karyotypes of the indicated control (ctrl) samples; n = 20 metaphases per sample. (D) Frequency of chromosomal gains (top) and losses (bottom) observed for each chromosome by seq‐iFISH analysis in control samples. (E) Modal number (MN) of chromosomal gains/losses in control samples. Graphs represent the mean value of three independent experiments and error bars represent the SEM; n = 200 nuclei were analyzed per experiment. (F) Single‐cell analysis showing the size of diploid and ‘false aneuploid’ clones observed in the control samples. Subclone formulas/codes on the left indicate the number of gains (1 or 2) or losses (−1) for the chromosomes X, 4, 6, 10, 14, 17, 18, and 21, respectively; n = 150 nuclei, 265 nuclei and 191 nuclei for controls 1, 2, and 3, respectively. (G) Single‐cell analysis showing the 10 major clones observed at diagnosis (DX) in all HHD‐B‐ALL patients; n = a minimum of 200 nuclei per sample. The size of the black circles in (F and G) represents the proportion of cells with the indicated subclone in each sample. [Colour figure can be viewed at wileyonlinelibrary.com]