
Fig. 3.
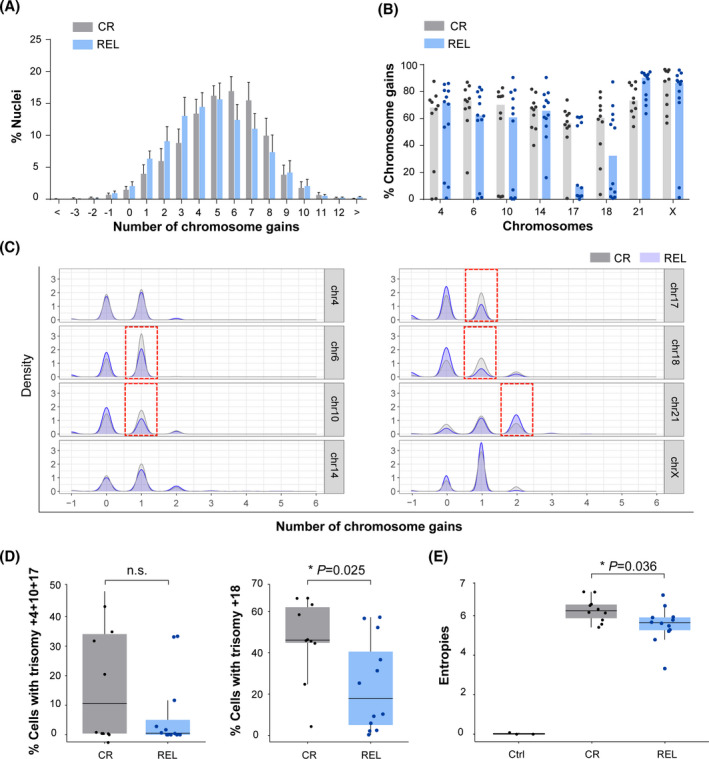
Differential rates of specific chromosome gains and clonal heterogeneity in diagnostic (DX) samples from complete remission (CR) and relapsed (REL) high‐hyperdiploid B‐cell acute lymphoblastic leukemia (HHD‐B‐ALL patients). (A) Number of total chromosomal gains in DX samples from CR and REL HHD‐B‐ALL patients. Graphs represent the mean value and error bars represent the SEM. (B) Frequency of chromosomal gains for the indicated chromosomes in DX samples from CR and REL HHD‐B‐ALL patients. Graphs represent the median values of total gains for each chromosome and dots represent the values obtained for individual patients. (C) Chromosomal gains as observed by density values in single‐cell computational analysis for the indicated chromosomes distinguishing the contribution of trisomies and tetrasomies. Red boxes indicate the differences observed in DX samples from CR and REL HHD‐B‐ALL patients. (D) Box plots comparing the frequency of cells harboring triple trisomies 4, 10, and 17 (left) and single trisomy 18 (right) between DX samples from CR and REL HHD‐B‐ALL patients. (E) Box plots comparing the clonal heterogeneity as observed by Shannon entropy values of data between controls (ctrl) and DX samples from CR and REL HHD‐B‐ALL patients. Boxes represent the quartiles 25–75 and horizontal lines represent the mean value. Error bars represent the standard deviation (SD); n = 3 ctrl, n = 10 CR, and n = 12 REL HHD B‐ALL patients; two‐sided unpaired t‐test. *P‐value < 0.05. [Colour figure can be viewed at wileyonlinelibrary.com]