
Fig. 3.
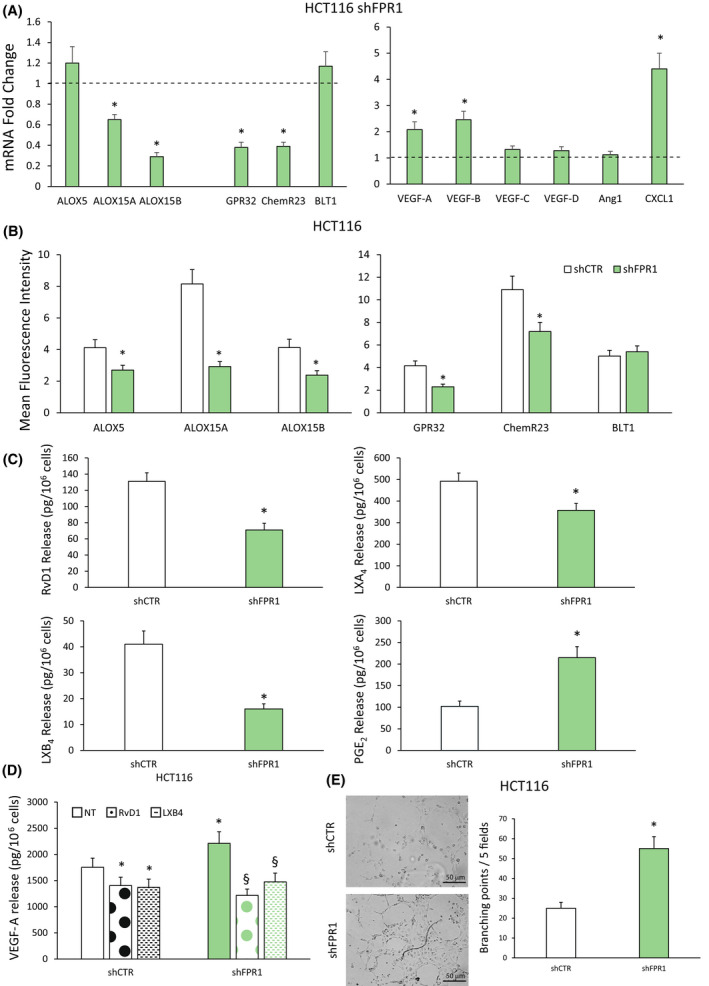
Effects of formyl peptide receptor 1 (FPR1) silencing on specialized proresolving mediator (SPM) biosynthetic machinery and angiogenic potential of colorectal carcinoma (CRC) cells. (A) ALOX5, ALOX15A, ALOX15B, GPR32, ChemR23, BLT1, VEGF‐A, VEGF‐B, VEGF‐C, VEGF‐D, Ang1 and CXCL1 mRNA fold change in HCT116 cells silenced for FPR1 (HCT116 shFPR1, three clones) compared to cells transfected with nontargeting short hairpin RNAs (shCTR cells—dotted line, a mass population). Data are represented as mean ± SD of five independent experiments. *P < 0.05 compared with the control (dotted line) by Student's t test. (B) ALOX5, ALOX15A, ALOX15B, GPR32, ChemR23 and BLT1 expression levels (mean fluorescence intensity), assessed by cytofluorimetric analysis, in HCT116 shFPR1 (three clones) cells and the relative control (shCTR, a mass population). Data are represented as mean ± SD of five independent experiments. *P < 0.05 compared with the relative control by Student's t test. (C) Proresolving and proinflammatory autacoid (RvD1, LXA4, LXB4, PGE2) release in HCT116 shCTR (a mass population) or shFPR1 (three clones). Data are represented as mean ± SD of five independent experiments. *P < 0.05 compared with the relative control by Student's t test. (D) VEGF‐A release in HCT116 shCTR cells (a mass population) or shFPR1 cells (three clones) treated or not (NT) with RvD1 (1 nm) or LXB4 (1 nm) for 12 h. Data are represented as mean ± SD of five independent experiments. *P < 0.05 compared with shCTR NT by Student's t test. § P < 0.05 compared with the relative control by Student's t test. (E) Human umbilical vein endothelial cells (HUVECs) were cultured in the presence of cell culture conditioned media (CM) from HCT116 shCTR (a mass population) or shFPR1 (three clones) (10× magnifications) in a 24‐well plate. After 12 h, cells were fixed with ice‐cold 70% ethanol, and tubule formation was evaluated. Sample images and a quantification of the angiogenic response are reported. Scale bar 50 μm. Data are represented as mean ± SD of three independent experiments. *P < 0.05 compared with the control by Student's t test. [Colour figure can be viewed at wileyonlinelibrary.com]