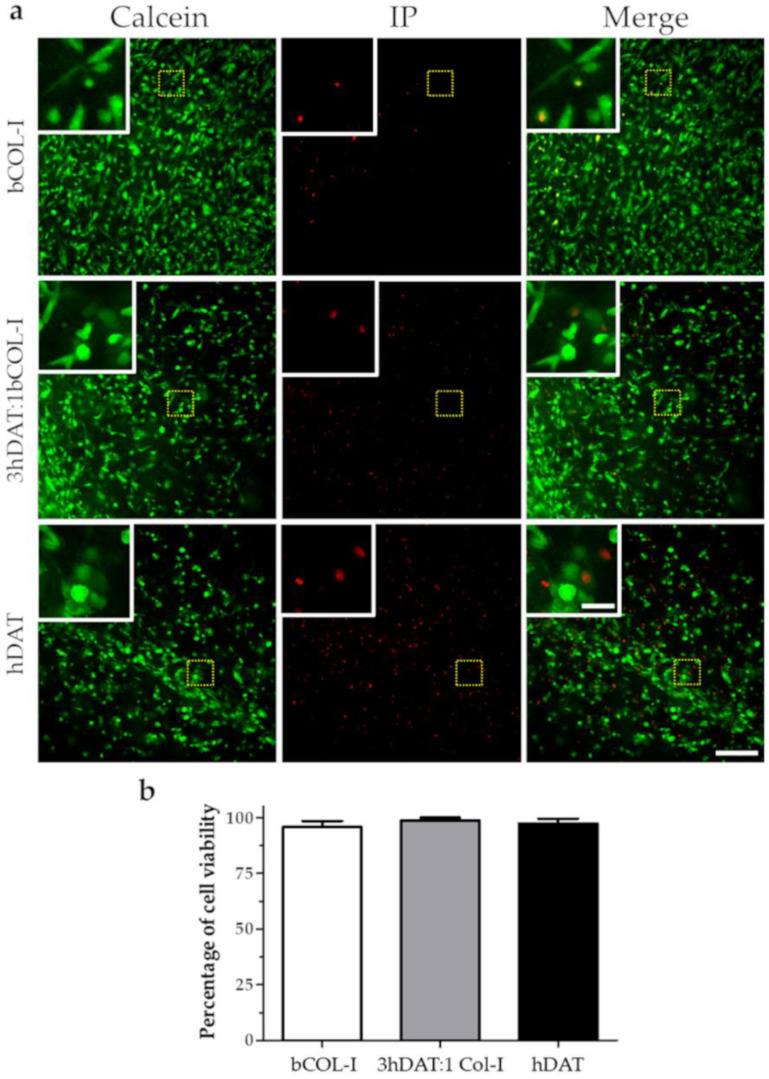
Figure 2.
hDPSC viability in solid foams after 72 h. (a) Fluorescence microscope images of live (Calcein-AM green) and dead cells (Propidium iodide red). Upper row: bCOL-I, middle row: 3hDAT:1bCOL-I; and lower row: hDAT solid foams (scale bars represent 200 µm, inset 50 µm). (b) Quantification of cell viability, data are represented as mean ± SD.

