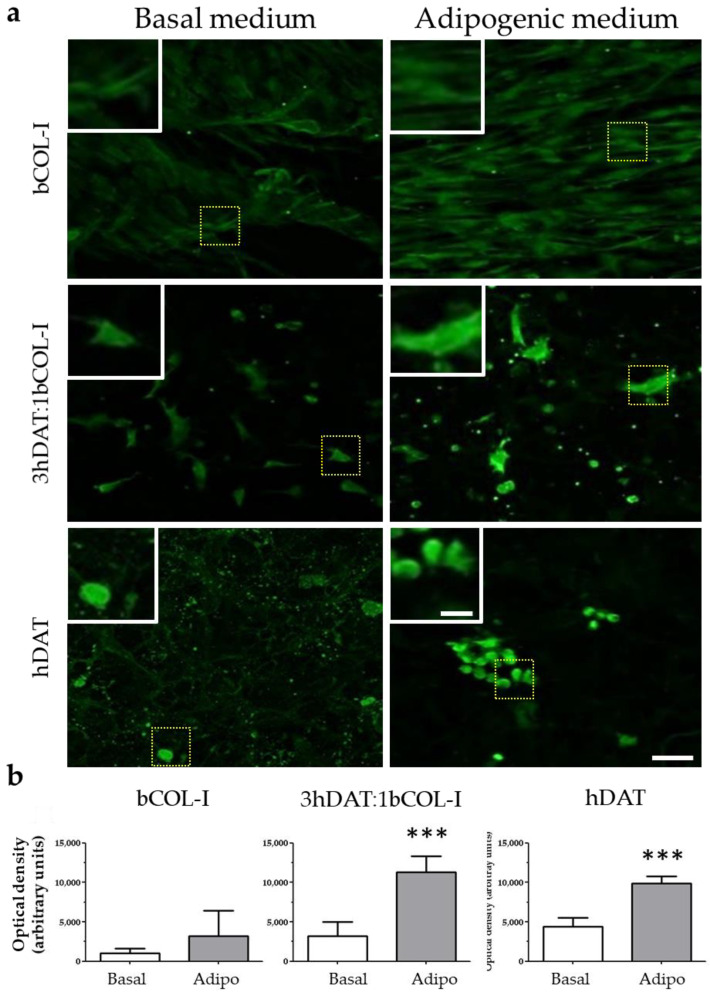
Figure 5.
PPAR-γ staining of hDPSCs cultured in solid foams with basal or adipogenic medium for 14 days in culture. (a) Images of immunofluorescent labeling against PPAR-γ (green). Upper row: hDAT, middle row: 3hDAT:1bCOL-I, and lower row: bCOL-I solid foams (scale bars represent 100 µm, inset 25 µm). (b) Quantification of the PPAR-γ signal of the different conditions. t-student *** p < 0.001.

